Can we trust the polls on policy issues?
Is the looking glass merely cracked, or completely shattered?
On Sunday, I wrote to you with an excerpt from my book about the benefits of thinking about polls as a “cracked looking glass” that sometimes distort reflections of the public’s attitudes, but otherwise serves an important institutional purpose that no other tools provides. We also talked about how we should approach defining “the public” anyway.
These questions matter for determining both how accurate polls are and how they get incorporated into the political process. This post offers a few additional thoughts and supplementary evidence for the former question: just how good are issue polls?
Editor’s Note: I would normally lock this post for paying subscribers, but since polls are again a topic of discussion right now, I’m sending it to everyone in hopes it gets wider circulation online. If you want to read more of my book-adjacent thoughts about public opinion and democracy, or just found this informative, subscribe below to get two extra posts like these each week.
Some polling analysts have recently taken to pointing out that the outcomes of popular initiatives and ballot referenda on issues such as gun control and environmental protection often do not align with the polls. This suggests the polls are flawed — perhaps even more deeply than is demonstrated by the recent high-profile misses in pre-election polls.
I do not think this is a valid way to measure the accuracy of issue polls. For one, most are taken among a different population: all adults versus people who turn out to vote in the election. We know these populations are different, with the former likely being much more liberal, so the expectation of 0 error between the poll and result is inherently violated. The language and context of ballot initiatives and referenda also deviate from the polls in meaningful ways. Mobilization of interest groups might also blow the results off course. Overall, there are too many intervening variables to be sure that the average absolute error of polls predicting results is all that meaningful.
For argument’s sake, let’s pretend that referenda are a suitable way to judge the polls. A fair, systematic accounting of their performance in historical referenda might yield a much better verdict than some cursory analyses suggest (despite how absolutely banger the tweets might be):
However, it is not clear to me that polls are actually this bad at predicting the results of ballot initiatives! Many gun control refernda have failed despite polls, sure. But others have fallen incredibly close to their forecasts.
Here is an email exchange I had with Charles Franklin, the pollster who heads up the Marquette University Law School Poll in Wisconsin:
Hey and hope all is well. Glad to hear the book is "almost" ready for print. Survive any revisions!
The topic of polling accuracy on policy issues is in the air. Indeed, I see it in your newsletter tonight.
I'm NOT specifically trying to brag on the @MULawPoll, but I think a natural way of considering "policy" polling is in comparison with referenda. Of course that isn't perfect. In this case the counties with referenda are not a random set of counties. But it is what we have.
As it happens, I literally just tonight saw this Milwaukee Journal Sentinel article on Marijuana referenda in Wisconsin in 2018. I had missed it entirely at the time.
https://www.jsonline.com/story/news/politics/elections/2018/11/06/marijuana-legalization-milwaukee-county-voters-favor-ending-ban/1811494002/
It includes this lovely paragraph:
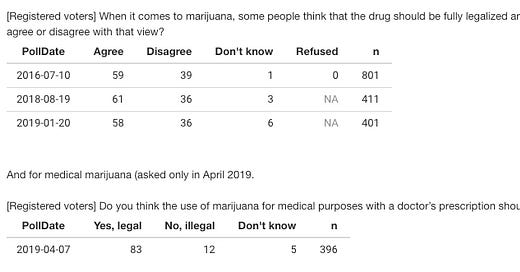
Franklin was kind enough to enclose the results of his poll and the county-level results of legalization efforts:
Here is our polling around the 2018 election:
And here are the votes in the counties, some of which had a medical referendum and some a general legalization referendum. These were county referenda, not statewide See here.
Legalize use:
Dane County 76%
Eau Claire County, 54%
La Crosse County, 63%
Milwaukee County, 70%
Racine County, 59%
Rock County, 69%
Counties/cities w medical vote:
City of Waukesha, 77%
Brown, 75%
Clark, 67%
Forest, 78%
Kenosha, 88%
Langlade, 77%
Lincoln, 81%
Marathon, 82%
Marquette, 78%
Portage, 83%
Racine, 85%
Sauk, 80%
The results of these referenda came within about 4-5 points for legalized use, and 1-2 points for medical use.1
Franklin sends along two parting thoughts:
Aside from being reasonably close on both legalize and medical, we also get the greater support for medical about right.
So for what one state, one issue, and one poll (with two questions!) is worth, I'd hold this up as an example of policy polls that seem to get the right answer for referenda.
Given the results from Wisconsin, it is not clear to me that policy polls are as bad as some people would like you to believe. At best, prominent examples are cherry-picked. At worst, they might overestimate support for liberal opinions by five to ten (or so) percentage points on the most salient issues (and perhaps less on others).
Recall that that’s about what we’d expect given that the non-voting population is more progressive as a result of being younger, less white and more educated than the electorate. If polls are supposed to represent the will of all people, they seem roughly around where they’re supposed to be.
While it is good to remind people that polls have a margin error — sometimes, that margin is very large — they are very likely better than you have been led to believe.2
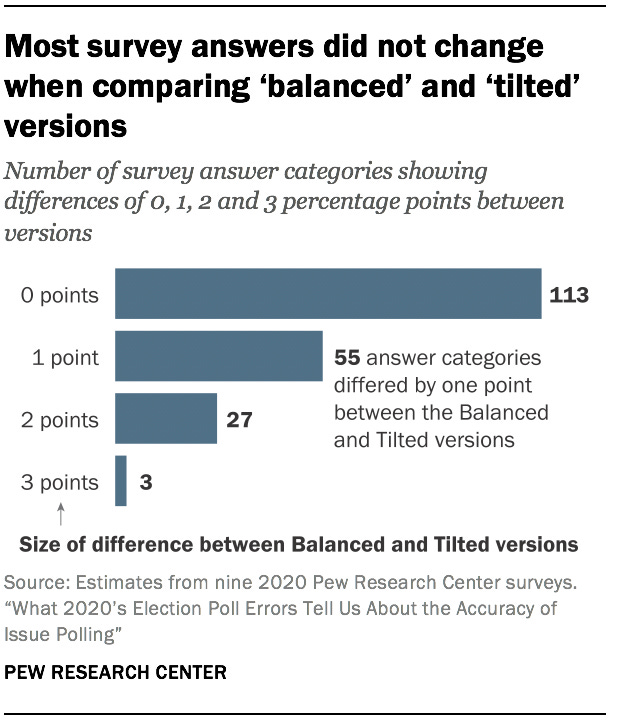
Allow me to draw your attention to a recent study conducted by the Pew Research Center. Their methodology team (where I used to work!) took the Center’s 2020 polls and adjusted them to create two different types of faux surveys: one, where the presidential vote margin between Joe Biden and Donald Trump was 4.4 points — the actual result of the election — and one where the gap was 12 points — representing the higher end of bias for high-quality national polls the week before voting day.
When Pew compared voters’ responses to an array of survey questions in the biased and the unbiased “polls,” they found that most answers did not change by very much. The biggest difference for the response to any given question was about three percentage points:
That is much smaller than the (cherry-picked, misleading) 40-point miss in Maine, though there are some caveats to the analysis:
It’s based on polls conducted by only one organization, Pew Research Center, and these polls are national in scope, unlike many election polls that focused on individual states. The underlying mechanism that weakens the association between levels of candidate support (or party affiliation) and opinions on issues should apply to polls conducted by any organization at any level of geography, but we examined it using only our surveys.
Another important assumption is that the Trump voters and Biden voters who agreed to be interviewed are representative of Trump voters and Biden voters nationwide with respect to their opinions on issues. We cannot know that for sure.
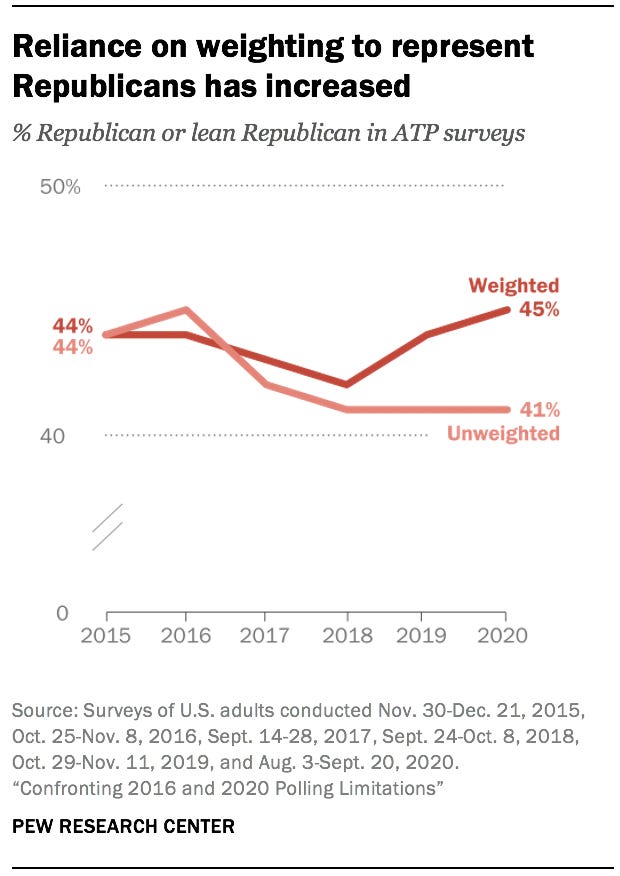
I think the latter (bolded) caveat introduces the highest chance that polls are uniformly biased toward progressive opinions. But another recent project by Pew has compared the political composition of respondents to an online survey and a poll fielded over snail mail via the US postal service. Courtney Kennedy, their director of survey research told me that the off-line survey was “meaningfully less biased” toward liberals.
“Meaningful” here is relative, however; Pew’s new data suggest that their unweighted surveys are only about 4 percentage points less Republican than they are after correcting to a high-quality benchmark that comes from the mail survey, which has a nearly 30% response rate.
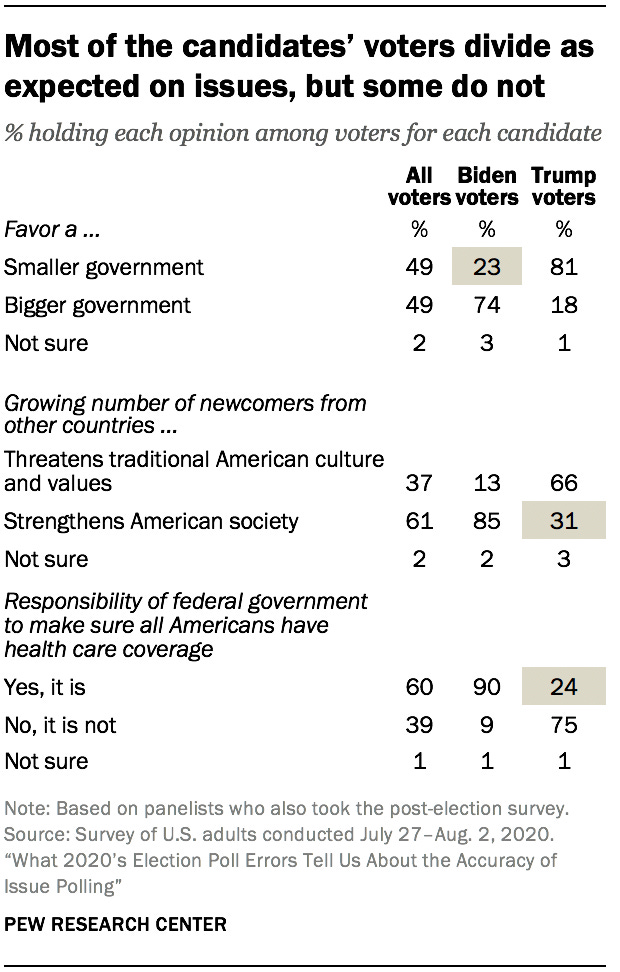
And since not all Republicans and Democrats are uniformly divided on issues, the bias on any given question is likely even smaller:
My goal with this is not to cheerlead for the polls. They have deep problems that will be hard to overcome. But it is worthwhile to put those problems in perspective and to realize that some popular critiques of the polls are not as clear as they seem. Since polls are the best — perhaps the only — mirror we have to observe a reflection of all people, it is worth being honest about the severity of their cracks. A shattered mirror is useless. A cracked one, if studied at the correct angle, nevertheless offers up a reflection.
Here, I’m using Wisconsin’s election results to project what would have happened at the state level, then comparing that to Franklin’s statewide polls.
We need more people to look smartly and systematically at the accuracy of policy polls!


Appendix A: I am also reminded that Pew got the exact percentage correct ahead of an Irish referendum on expanding abortion rights. 66% of Irish adults told Pew they favored expanded rights, and then 66% of Irish voters ended up voting that way: https://www.pewresearch.org/fact-tank/2018/05/29/ireland-abortion-vote-reflects-western-europe-support/
Great post. What evidence do you have that the non-voting population is "much more liberal" than the voting population? I was struck by how much turnout increased in 2020 from 2016 and yet the national popular vote went from about +2 Dem to +4.5 Dem.