Happy Election Day -300!
Polls are now officially not totally useless at historical election prediction (this is not a guarantee for the future)
I have seen enough social media posts about poll toplines, crosstabs, and averages this week that, if I had just woken up from a coma, I’d think it were November. In fact, it is only January 10th! There are no elections today! There is a Republican presidential primary debate between Ron DeSantis and Nikki Haley — which is why I’m up late and blogging to fill the time — and Iowa is next week, but there are no elections today.
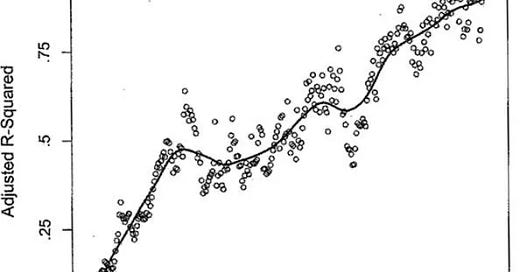
Nevertheless, today is special to a small crowd of the poll-obsessed journalists and political scientists who recognize the following chart:
The chart is from political scientists Robert Erikson and Christopher Wlezien’s 2012 book The Timeline of Presidential Elections, which looks at how, when and why voters make their decisions about who to vote for. The chart shows you how predictive horse race polls are of actual election outcomes between 1956 and 2008.1 Here’s how to read it: On the left, we’re at 300 days before the election, when polls are of little to no predictive value historically. On the right, it’s Election Day, when polls explain the vast majority of variation (R-squared, the y axis) in the Democratic candidate’s actual share of the popular vote.
In other words, polls are not super useful 300 days before the election, but become more useful as November approaches. And, lucky us, we are now 300 days before November 5th, 2024! It’s Election Day minus 300, or ED-300 as elections forecasters like to say. Happy ED-300! This also means that the last few months of poll discourse have taken place entirely to the left of the axis on the above chart — a time period when polls were so inaccurate historically that they were excluded from the analysis.
I should say the precise numbers here are a little fuzzy, but the predictive margin of error for presidential horse race polls starts out at about +/- 20 today, in terms of Democratic margin. That means if the polls had Biden up 10, he could end up losing by 10 — or winning by 30 — in one out of twenty elections. Obviously, because of political polarization and other factors, those margins are unlikely today. A true forecast would take into account other information about our world. but that’s not the subject of this post.
The upshot of all this is that if you’re looking at polls today, they are historically unreliable at telling the difference between a Biden-leaning or Trump-leaning election at this point in the cycle.
This goes doubly, by the way, for crosstabs of presidential vote choice. I remember in the run-up to 2020 the crosstabs had most election observers convinced that Joe Biden would make major inroads with rural and non-college-educated whites. In fact most shifts in vote choice among these groups were on the order of one or two percentage points. There may be some wisdom there for people reading crosstabs showing 20 and 30 point swings in vote choice between 2020 and 2024.
So stop freaking out on Twitter! Happy ED-300. We now begin a long climb up in the predictive power of horse race polls!
Were we to update the data through 2020 and redo the analysis, the results may change slightly but the overall takeaway would not.


When you say a margin of +/- 20 points, what uncertainty measure is this? Standard deviation of the change? A 95% prediction interval? Something else I'm not thinking of!