


With nine days left, massive polling error is Donald Trump's best shot to win
He has run out of time to truly turn things around

There are two major sources of error in handicapping the election. The first is the chance that the electoral environment changes between whatever day you’re making the forecast and election day. The second is the chance that the polls are so systematically biased toward one candidate that the other one pulls off a surprise victory (see: 2016).
With only nine days left in the election, Donald Trump has lost the majority of the cushion that the first time of error offered him.
Let me explain a bit more. Election forecasts work by exploring a range of potential scenarios for what the future might bring. Hence the forecast. You can think of those futures as getting less predictable over time, forming a cone of potential increases or decreases in a candidate’s share.
Over the last 6 election cycles, the margin of error on the movement in a Democratic presidential candidate’s polling margin from 300 days out to election day has been roughly 20 percentage points. We can also define that margin of error as its standard deviation, which is about half of the MOE or 10 points on a candidate’s margin. And, as you can imagine, that standard deviation decreases over the course of the election cycle.
You can chart this relationship as follows, where the standard deviation in the future movement of the polls increases as a square root function of time.
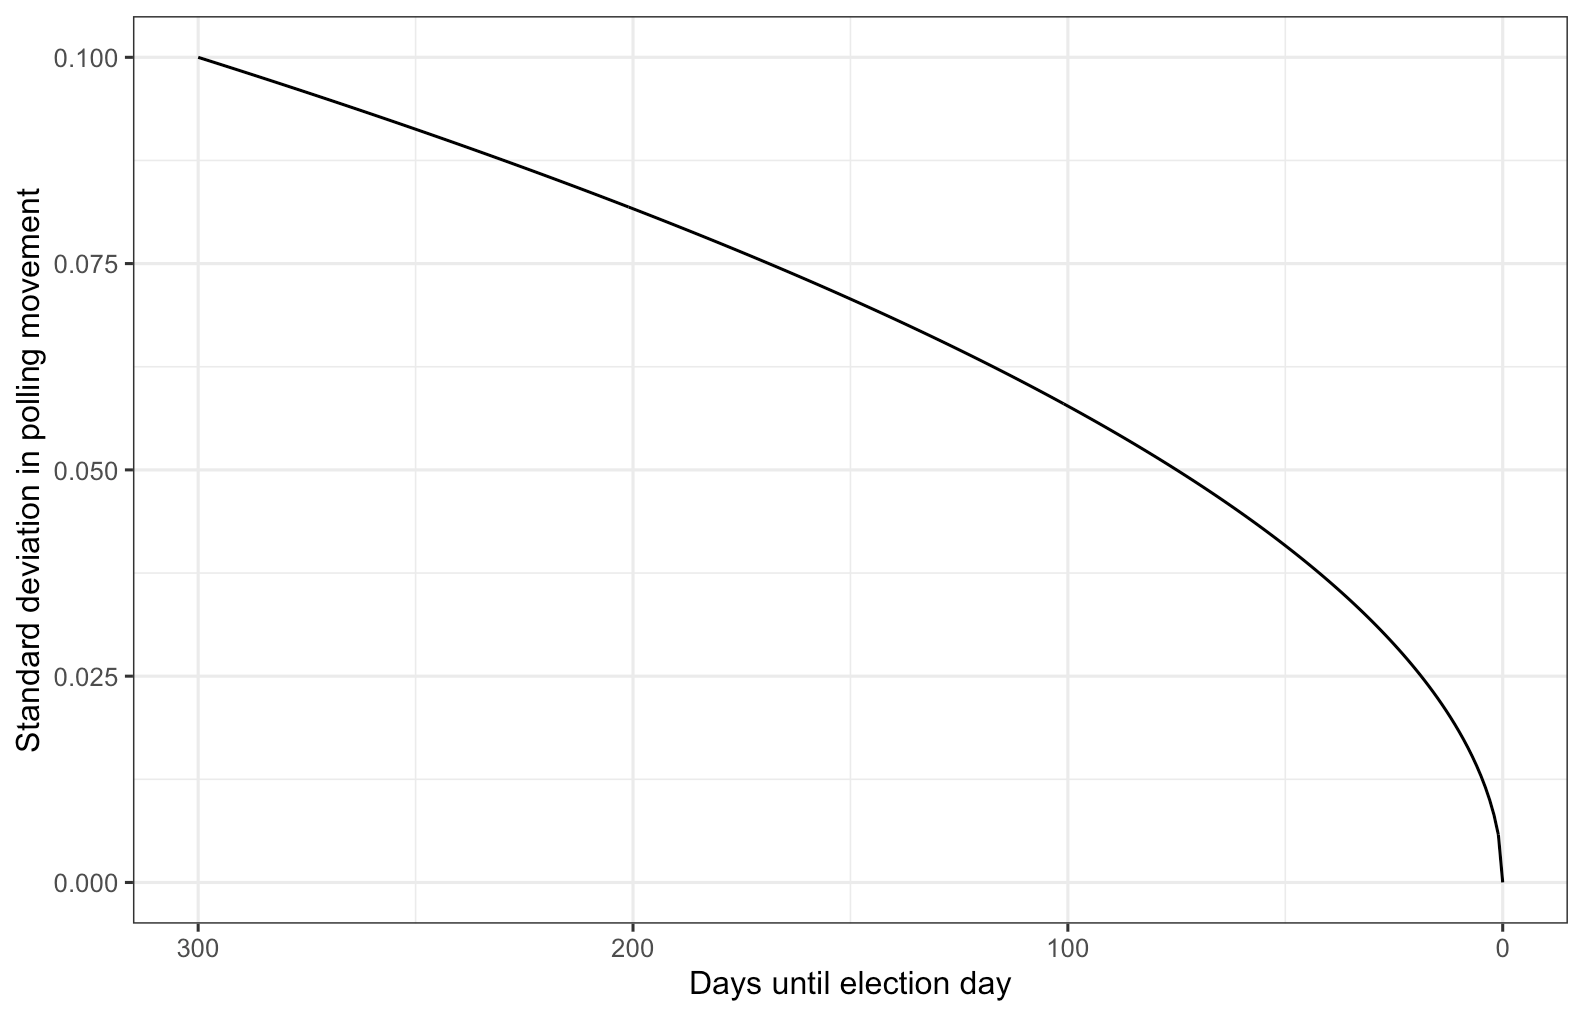
This graph shows you that at 300 days before the election, our prediction of the Democratic vote margin a candidate in the average election could change by as much as 20 points (0.1 — on the probability scale — times 1.96) by the time polling day arrives. And with two and a half months remaining, the margin of error on the future movement shrinks to half of the full amount.
Here’s another chart that shows where we are today, nine days before the election. Right now, a model based on these numbers would say that 97.5% of the time, polls wouldn’t move toward the Democrat by more than about 3.4 percentage points or a standard deviation of 0.017 - 0.018.
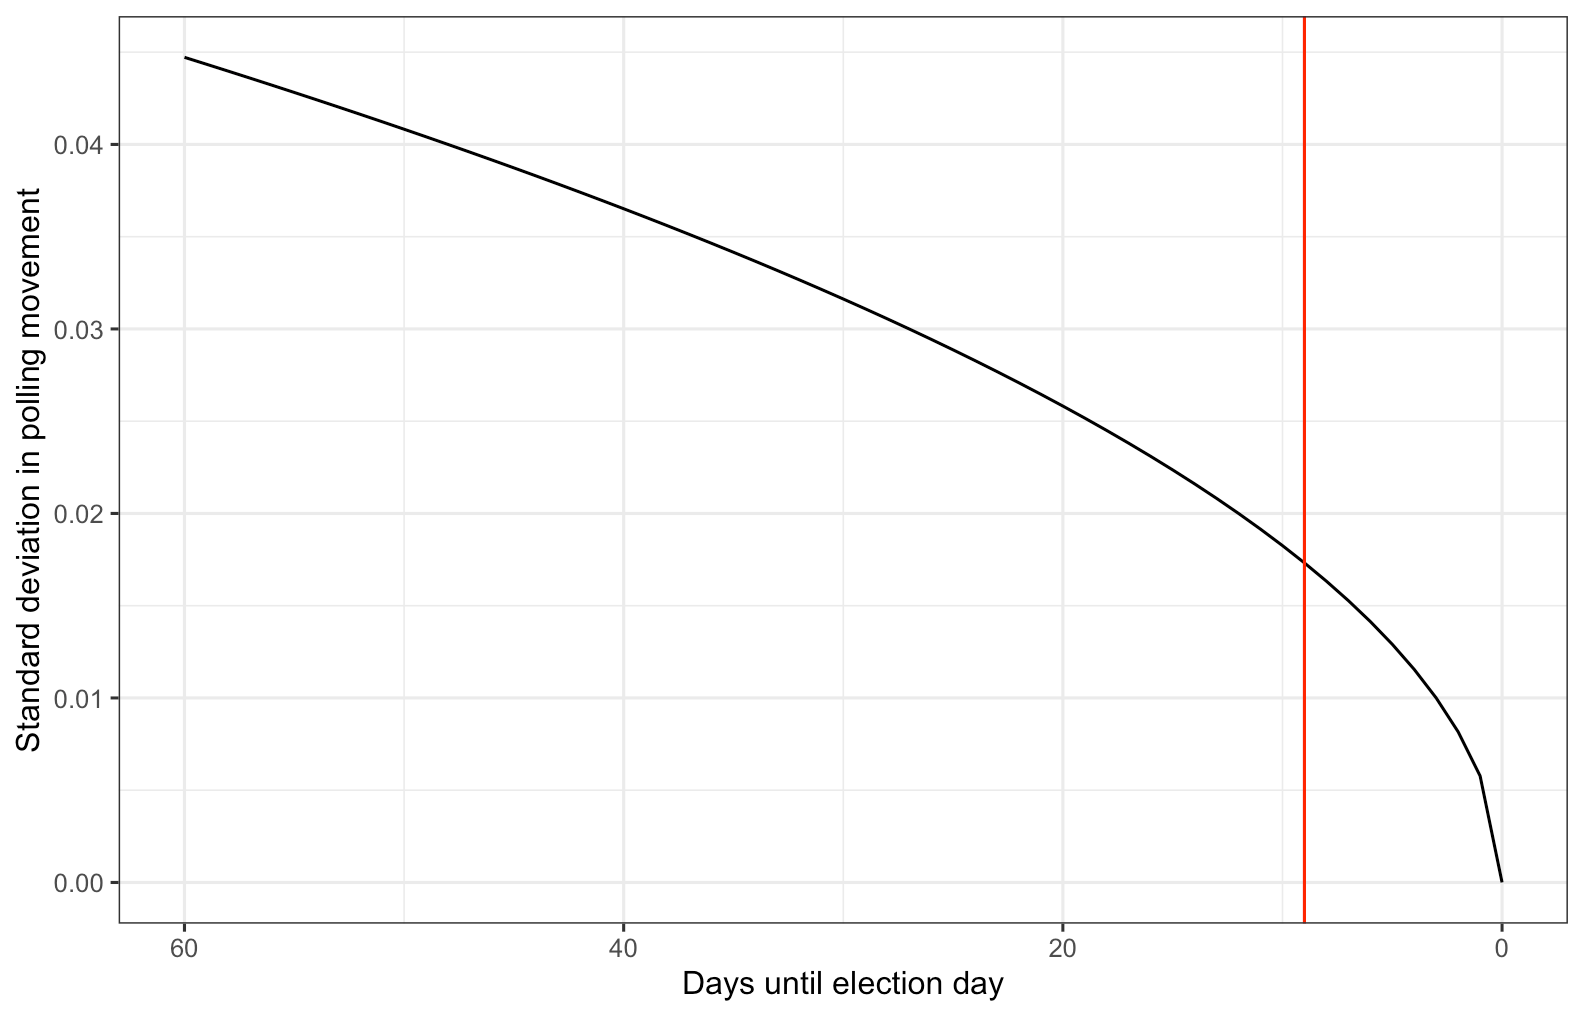
This is incredibly damning for Trump. He is down 9-10 points in national polls — or just over 8 points if you take the margin implied by state polls — and a model with this level of national polling drift would stipulate he would lose by less than 5-6 points in only 2.5% of cases. And even though Trump has a relative advantage in the electoral college, it is not large enough to overcome those biases.
Unless… unless the polls are wrong.
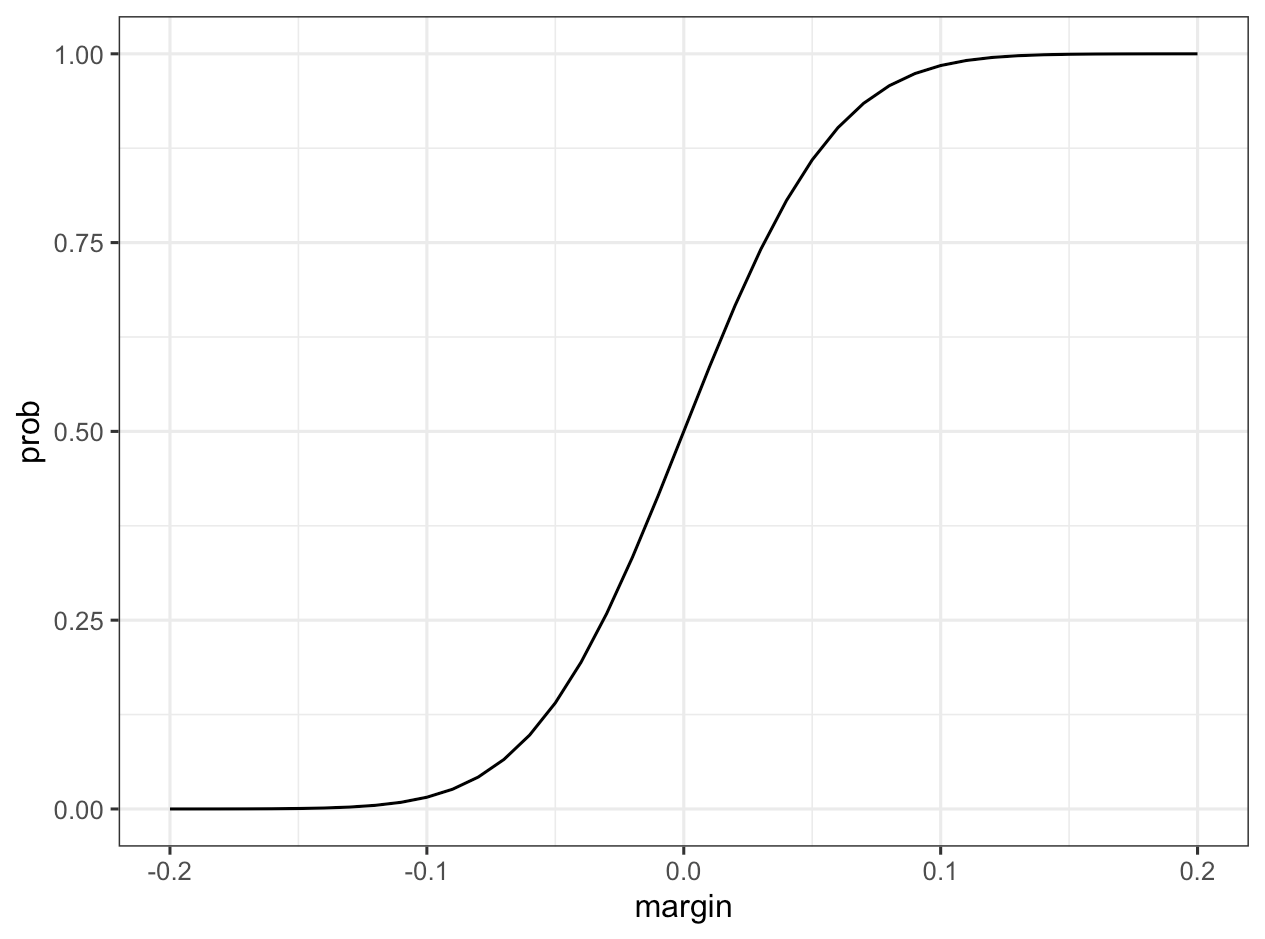
And that brings us to the second type of error, the only remaining statistical factor that still gives Trump a chance. Again in my modeling, I’ve found that the margin of error on state-level polling averages between 2000 to 2016 is about 9-10 percentage points, or a standard deviation of 4.6. Let me assume that outcomes are normally distributed for now (they’re not) and show you this chart, which plots a candidate’s chance of winning in a given state conditional on their average polling margin. At a 5-point margin in a state, a candidate would have an 86% chance of winning in the state.
So, the chance that Trump wins the election is a product of his chances of winning in the states he needs to win the electoral vote majority, with some reasonable constraints on the correlation between states. The best way to game out those scenarios is, of course, with a model. By now you know that I have built several this election cycle — but for now, take a look at my toy model on GitHub.
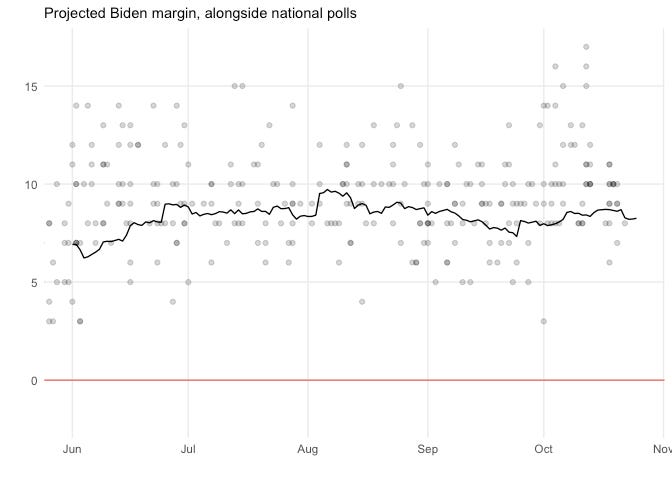
Here is Biden’s predicted national vote margin (the one implied by state polls):
Here are the state-level averages:
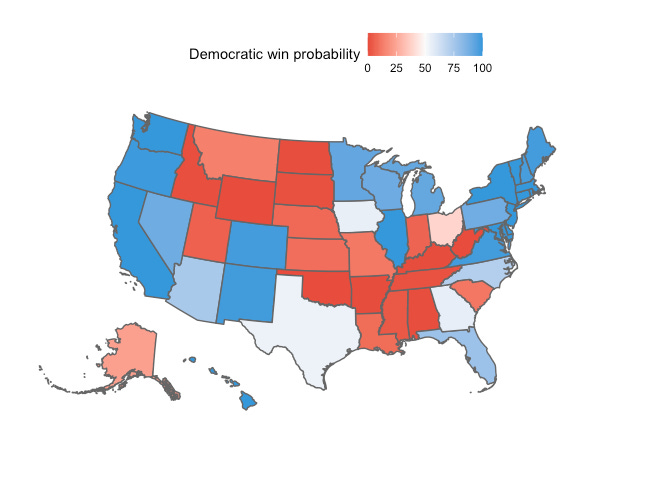
And here is the current histogram of election simulations, which game out national, regional and state-level polling errors:
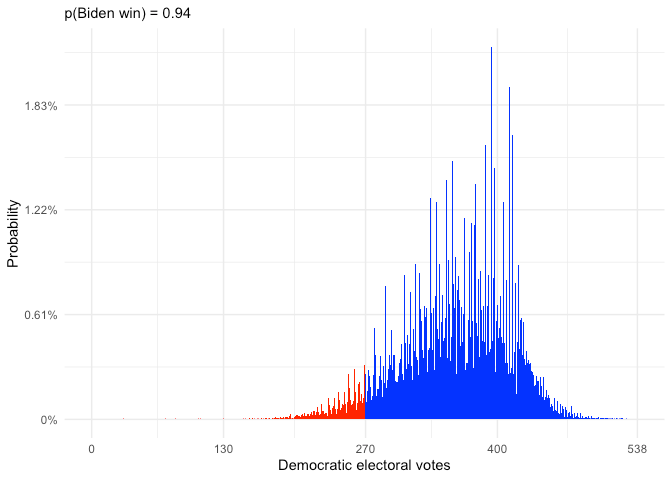
Here we finally see that, lacking a path to a victory by actually gaining ground in the polls, even the chance that polls are wrong enough that Trump is actually is very small. But still, the second type of error increases his chance at winning the White House by about 25x:
> pnorm(3,8,1.7)
[1] 0.001634841
> 0.04 / pnorm(3,8,1.7)
[1] 24.46721
So… that ain’t nothin.
This seems like a good post for this question, but how much can you factor in errors related to demographic change since the last actual census?
I know that the census has yearly estimates but do particularly dynamic or fast-growing states such as Texas or Florida have extra error assumed in their polls?
While the map should speak for itself, I still wonder about the implicit conclusions about TX, GA, IA and OH. Biden has a better chance in these three states than he has in OH, or at least measurable enough that the shading is different on the map? The first three have moved left in the last 4 years while with Ohio, not so much?