The (good) pollsters got the midterms right
Pundits who ignored the polls and predicted a "red wave" got burned
A day before the election, I published an article for The Economist titled “Why a Republican ripple is more likely than a red wave.” In it, I wrote about the paper’s polling averages and forecasting model. The data team saw a small GOP win as most likely in the House and a toss-up Senate race. This was all according to our analysis of the polls and fundamentals.
The Economist was not the only one to get this election mostly right. FiveThirtyEight did too; their models had Republicans winning 230 (+/-30) seats in the House and also saw a tight Senate race. Those look now to be a little optimistic for Republicans (especially on the House side), but the result will be well within their margin of error — with Republicans probably winning around 220 seats, though there are still votes left to count.
The performance of the forecasters this year is a stark contrast to their (our) 2020 projections, especially in the House. Then, FiveThirtyEight gave Democrats only about a 5% chance of winning the number of seats they actually won (222) or fewer. The result that year also landed outside of The Economist’s uncertainty interval. Also wrong: betting websites, race-rating organizations such as the Cook Political Report and most newspapers.
The forecasters were “right” this year and “wrong” last year primarily because of the polls. Last time, the average poll overestimated Joe Biden’s margin of victory in the national popular vote by about 3-4 percentage points. Polls in the average competitive state had a slightly larger degree of bias — overestimating Biden by about 4-5 points. According to the American Association of Public Opinion Research, it was the worst performance for the polls since 1980. In the industry, we call that an “above-average error”; The media called it a catastrophic failure. Many declared polling hopelessly broken and irrelevant.
The naysayers overstated their case. This year, the polls did very well. By some measures, in fact, the Senate polls tied their best performance on record — the last great performance being in 2006. This was, of course, predictable; I wrote a whole book about why people who said the polls were broken were wrong. But how is it that they did so well? And have pollsters fixed the problems that threw off their estimates in 2020 and 2016?
It will take months for pollsters to conduct their official post-mortems, but here are some things we know right now.
1. Individually, “traditional” polls did very well
First, traditional pollsters who use live interviewers to poll voters over the phone did very well. They may have even done better than pollsters who use other methods. According to some math by my friend Alexander Agadjanian, a political science PhD student at Berkeley, the average error for all polls of Senate races was about 2 points on vote margin. Breaking performance out by pollster mode, he finds that live-caller phone polls were about 0.15 points lower than for mixed-method polls. Online-only polls were about 0.41 points worse. 1
To be sure, those are small differences, and they may only be suggestive. But the fact that live-caller polls still met the performance of polls using another mode (at least based on this early look) is an improvement on 2020, when many of them did worse, especially at the state level. On top of that, polls from the more traditional firms also did well — perhaps even better than most of the newer shops (we’ll need final data in each race to be sure). According to an analysis of polls and results by Emily Ekins, the director of polling at the Cato Institute, and Patrick Murray, the pollster at Monmouth University, polls from universities or major media outlets had errors about 1.5 points lower than the errors for polls from smaller firms.
This is an important point, but not for the reason you think In 2020, “traditional” polls suffered perhaps the worst from partisan nonresponse in their data. That was true for even the good live-caller polls, such as the New York Times/Siena College surveys, that tried tricks like stratifying their samples by party and weighting on respondents’ predicted response rates. But they still ended up biased, and many of them ended up with very high variances due to excess weighting (see chapter 7 of Strength in Numbers). This year, those same pollsters appeared to have done better than the average poll —even though very few of them changed anything about their approach to polling.
What this means is that these pollsters probably just got lucky this year. Maybe that’s due to a decrease in partisan nonresponse. In the week before the election, it looked like nonresponse in live-caller polling data had subsided somewhat, marking a sharp change from expected heightened levels earlier in the campaign. And several online pollsters were telling me privately that their data showed Democrats, not Republicans, had higher rates of refusing to fill out surveys. Another possibility is that they literally just got lucky; there is a lot of randomness in survey data, and different polls could have ended up a little worse.
Observers, in turn, would be foolish to expect polls to do perfectly fine again in 2024. They have not solved the fundamental problem with polls these days, they just avoided it—this time. In this way, 2022 reminds me a lot of 2016; on average, polls did well after doing badly. But that was not predictive of how they’d do in the future. The pollsters’ performance this time won’t be, either.
2. GOP-leaning polls biased (dumber) polling averages
So that’s the state of the polls. Now, let’s talk about the aggregates.
Here is what I see as the biggest story: Ahead of the election, there were concerns that a surge of polls from Republican-leaning firms was biasing the polling averages and, in turn, pushing the media narrative too far in the Republican direction. I think this was correct—but the precise impacts of those biased firms depend on which aggregator you were looking at. This is important so let’s dwell on it for a few paragraphs.
First, take the polls in Arizona’s Senate race. The final aggregate from RealClearPolitics, which uses a simple moving average of recent polls to combine separate surveys, showed Republican Blake Masters ahead of Democratic incumbent Mark Kelly by 0.3 points. That aggregate consisted of four: a Masters+1 survey from Trafalgar Group (which has overestimated Republicans by about 1.3 points on average in previous elections, according to 538 pollster ratings), a Masters +1 survey from Data for Progress (which had a Republican-leaning House effect this cycle, per The Economist’s formulas), a tied survey from InsiderAdvantage and a Kelley +1 poll from Remington Research (which conducts surveys on behalf of Republican political candidates and organizations).
What would the aggregate of those polls have shown if you designed a polling average that knows about the individual biases and house effects of each poll and adjusts for them? FiveThirtyEight, which estimates these “house effects” for each survey and then subtracts estimated bias from each poll, had Kelly up 1.5 points. The Economist, which goes one step further and removes not just the estimated in-cycle house effects but also the historical bias from each poll (eg, this would have moved the poll from the Trafalgar Group even more toward Kelly) had the Democrat up 2.1 points. The combination of those adjustments has evidently yielded a more accurate average, at least this time; Kelly is likely to win by about 3-4 points when all votes are counted, according to estimates of the partisan composition of mail-in votes.
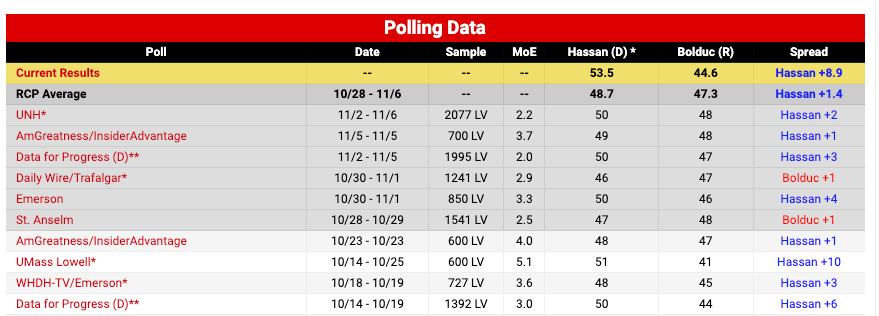
A similar story played out in other states. Four of the final five polls of the Pennsylvania Senate race have GOP house effects or historical bias scores, according to The Economist’s model. It was the only model to have Democrats in the lead in Pennsylvania. And in New Hampshire, GOP-leaning pollsters published nine of the final 10 polls. If your average didn’t account for that, you got burned:
In other words, polling aggregates are still useful, but the signal you extract from individual surveys depends heavily on how you treat the pollsters. Clearly, selecting the most Republican-leaning firms based on the theory that polls always underestimate the GOP did not work out well for RealClearPolitics. But even FiveThirtyEight’s house effects did not accurately account for these biases. The Economist’s approach got their averages closer — we were about one point more favorable to Democrats than they were — but still underestimated Democrats in states like Pennsylvania, New Hampshire, and Washington.
A related point is that pollsters such as Trafalgar Group, Rasmussen Reports, Insider Advantage, Wick and others are not just biased toward Republicans, but also bad pollsters. They regularly produce crosstabulations of vote shares that do not make sense (Republicans winning 30% of African Americans and Democrats winning 60% of whites); are methodologically opaque; do not adhere to reasonable industry practices for survey sampling and post-processing; and, in some cases, are outwardly ideologically biased against Democrats.
3. Polls are not perfect, but they also aren’t worthless
To be fair, I think it was justifiable to question whether the pollsters would get this election right. I did my fair share of raising the red flags — in this newsletter and elsewhere. But there is a difference between asking if the underlying data-generating processes of polls and the aggregates are working properly and asserting that they are not. The former helps you calibrate expectations and explain uncertainty in the data. The latter is a recipe for disaster.
Yet there is danger in overcorrecting. The post-2016 conventional wisdom about the polls was plainly miscalibrated — dare I say hostile. Yet that is partly because of a past era when people were too confident in them. Pollsters and forecasters produced such accurate forecasts of the 2008 and 2012 elections that most in the media came to trust that the nerds would always be able to call 49 or 50 elections correctly. That was never the case.
Perhaps now we are in a healthier middle ground between those extremes. The informed consumer of the polls would neither expect laster-like predictive accuracy of them nor dismiss surveys as worthless outright. This election has shown how far you can go with of a rational, empirically grounded approach to quantifying uncertainty in the polls. It has also shown the utility of not taking every pollster at face value. Aggregation algorithms that both weight pollsters for their past accuracy (as FiveThirtyEight does) and adjust them for their past biases (an approach I advocate for) outperformed the others. That is a lesson I’d like to see discussed more among the polling nerds.
Yet it bears repeating that the good aggregators owe their success this year to the (good) pollsters. They have had one of their best showings ever. Maybe now we can move on from the “polls are worthless” narrative once and for all. That would be better for political journalism—and probably democracy, too.


