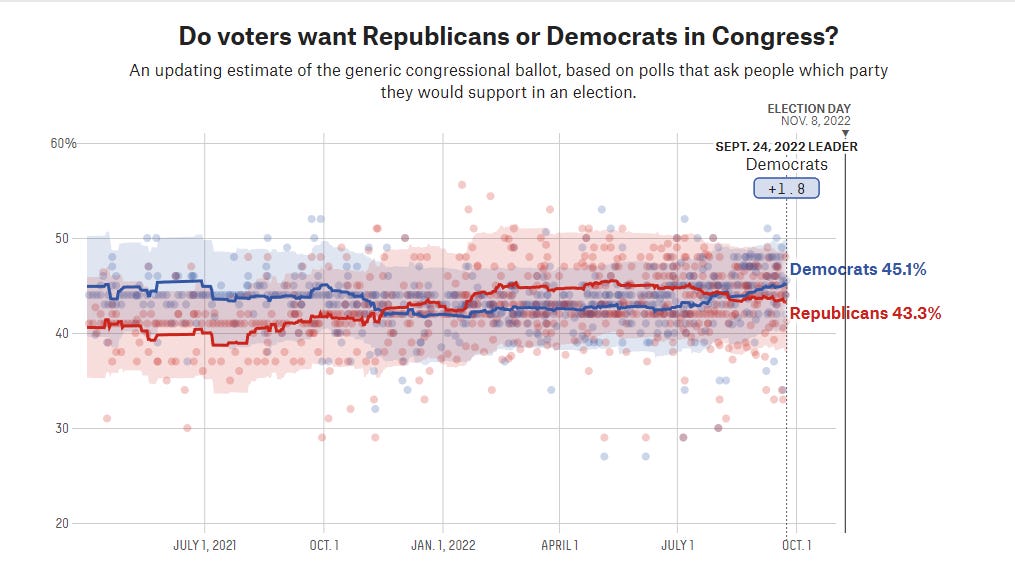
For a brief hour yesterday afternoon, FiveThirtyEight’s aggregate of House “generic ballot” polls showed the Democrats beating the Republicans by 2 percentage points.
That is not an important number in and of itself — the relatively high degree of sampling and non-sampling error in polls means you should not read too much into the precise rounding of decimal points in these averages — but it did cause me to think about something else worth writing about. And that is: What percent do Democrats need to lead this indicator by to be favored to win the majority of House seats come November?
The generic ballot is now D+1.8, which is different from D+2, but not really
To arrive at such a number, we need first to get an estimate of how far to the left or the right each congressional district would lean in a completely tied national race. One crude measure of this is each seat’s “partisan lean,” which measures how much more Democratic or Republican the seat was than the national popular vote in the last two presidential elections. Compute those scores for every district and you get a median seat today that is 2.5 percentage points more Republican than the nation as a whole.
Put another way, this implies Democrats need to win the national popular vote by 2.5 percentage points to win the House majority.
But this is not the only factor to consider. Other predictors of House election results include: whether a congressional district tends to be bluer or redder in House elections than in presidential contests; whether an incumbent is on the ballot; whether one of the candidates is significantly more ideologically extreme than the other; whether one candidate has significantly more experience than another; whether one of the candidates is a significantly better fundraiser; and so forth.
Add up these factors and the Republicans’ modified structural advantage is closer to 0.5-1 point (the 538 number is 0.6), much lower than the 2.5 we get from their raw partisan advantage in presidential races. (Most of that decrease comes from the quality and ideology differentials; Republicans voters’ nomination of extremists and candidates with few qualifications has materially harmed their prospects of taking the House.(
More to the point, that 0.5-1 point is also the number to watch in the generic ballot. Come election day, if Democrats are up 0.5-1 points nationally they will be favored to take the chamber.
Of course, that raises another question: If Democrats are up 1.8 points today, why are they not favored to hold their majority (at least according to 538’s “lite” forecast)? The culprit here is mean-reversion. Between this point and election day in past midterm cycles, the party controlling the White House has tended to lose about 2.2 points on average in the generic ballot. Forecasting that reversion forward, this decreases the Democrats’ expected election-day vote margin from 1.8 to -0.4 points. Since we are so close to the tipping point for control of the majority that makes a large difference probabilistically.
The upshot here is that as election day nears, this mean-reversion penalty will get smaller. That means Democrats’ odds of winning the House majority will increase even if they stay at exactly the same position in the polls. Keep an eye on that ~0.6 percentage point number.
The idea that Democrats could defy historical patterns and hold onto the House and the Senate seems pretty crazy to me, but that appears to be a real possibility. I was pretty skeptical of Democrats' chances for the midterms after 2020, but circumstances change.
BTW, did you end up naming your puppy: Maple, or Bagel?
I’ve been thinking of this in terms of our models’ error terms. Is there a story that I can use to talk me into a year where Dems lose 3 seats or less instead of 28 (which is the average for midterms since 1934)? I’m not sure. I can talk myself into 15, or even 10. Coincidentally that’s where the models appear to be right now.


Hi Elliott,
The idea that Democrats could defy historical patterns and hold onto the House and the Senate seems pretty crazy to me, but that appears to be a real possibility. I was pretty skeptical of Democrats' chances for the midterms after 2020, but circumstances change.
BTW, did you end up naming your puppy: Maple, or Bagel?
I hope all is well,
Elliot
Hi Elliot,
I’ve been thinking of this in terms of our models’ error terms. Is there a story that I can use to talk me into a year where Dems lose 3 seats or less instead of 28 (which is the average for midterms since 1934)? I’m not sure. I can talk myself into 15, or even 10. Coincidentally that’s where the models appear to be right now.