The fall has arrived here in Northern Virginia and I’m enjoying writing this thread on the airy balcony my wife and I grow our herbs on. It’s good to get out of our office and spend some time writing on a smaller screen ten feet away from where I normally sit. (Oh my god, is this nature? Is this what it was like for Thoreau to live in Walden? Blogging in the open-air — Is this transcendentalism?)
Something came across my feed today that dovetails nicely with much of the content of this newsletter. Data for Progress, the left-leaning but pretty methodologically rigorous survey-driven think tank, has released a study into the likely political benefits of Biden’s expanded Child Tax Credits (CTC), which passed with the American Rescue Plan earlier this year and gives families with children about $1,600 more dollars than the previous CTC laws. The topline takeaway from Data for Progress’s survey is that giving people money makes them like you. (No way!)
Jokes aside, though, this is an important thing for people to study. Whether voters reward parties for doing things that benefit them is both a fundamental question for democratic responsiveness and a key strategic question for the parties. If politics were non-transactional and all about group conflict and #owning the other side, we couldn’t reasonably expect politicians to ever act in our favor, could we?
So Data for Progress conducted a poll of just over 14,000 or so Americans and asked them various standard demographic and political questions, as well as whether they received the CTC this year and whether they felt favorably (or not) towards Biden and the Democratic Party. As a topline, they found that Biden’s favorability rating was about nine percentage points higher among CTC recipients (58%) than non-recipients (49%).
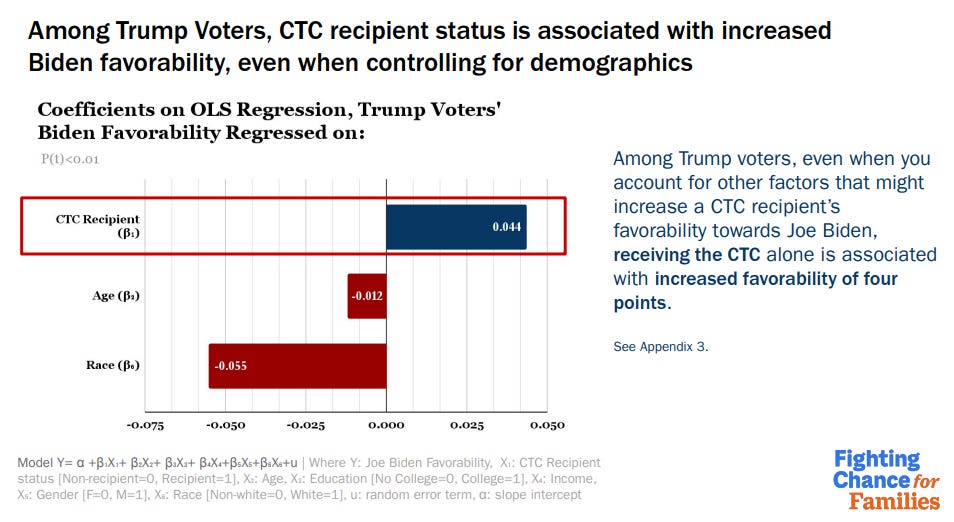
Because Data for Progress collected all those other variables, they could also (try to) control for other factors that might explain the difference. Maybe CTC recipients are just more likely to be Biden supporters for some other reason, like having kids? Or maybe they’re less white than the population as a whole? Etc. But that’s not the case! After controlling for other variables, they still find a 4 percentage point boost in Biden’s favorability rating among the whole sample. And they estimate roughly the same residual effects among Trump voters. Receiving the CTC was associated with a 7-point increase in favorability towards the Democratic Party more broadly among Trump voters. That might tell us something about credit claiming in an environment when partisans don’t usually hear about good things other parties might do for them.
Here’s a slide from a presentation of their results:
This is not totally surprising to me, but as we are all empiricists here, it is good to have actual evidence that giving families money is like, totally good man — at least in terms of transactionalism.
But here are two bits of context that I think have gotten lost in The Discourse around this study. First, we don’t really know that these effects are causal. There could still be something systematically different about people who do and don’t get CTCs that is not being captured by the controls for age, education, income, gender, and race. But I had the survey methodologist who supervises some of the Data for Progress research control for CTC eligibility (whether a person has a child they claim as a dependent on their taxes) and they still found the same effects! That makes it very likely that there is something different about the people who actually get the credit, not just their demographic profile (or else adding the control for eligibility would diminish the effect fo receipt). So I do think the evidence here is pretty strongly suggestive of causal effects, but I still would like to see something more exacting. If you conducted this study before and after people got the CTC, you could look at whether the effect of eligibility on Biden’s favorability changed before and after the CTC roll-out, for example. Even better if you had panel data (where pollsters ask the same set of people questions over time). You can think of other ways to isolate the effect too.
The other thing to keep in mind is that these 4-7 percentage point effects are isolated among the ~17% of the electorate that received a CTC this year, and the higher effects are further isolated to the smaller subset of those recipients who also voted for Trump — probably around 8-9% of the population. So if you’re trying to game out the effects of this electorally you’re only talking about a ~0.5 point increase in favorability towards Biden and ~0.6 point increase in favorability towards the Democrats. So these are not coalition-changing effects. However, remember that in close elections, small changes in inputs can make big differences for outcomes.
One question I have here is why there were so many people in the sample who did not receive the CTC? The sample says "83% not child tax credit recipients". My understanding of the CTC is that it was (essentially) supposed to go to all parents, except for those with very high incomes. Any ideas?
Probability of contacting 14,000 individuals and 83% not receiving child tax credits; what if we assume 50% of 35.2 million families ~17 million individuals. .
Well, the probability of being significantly off due to sampling error alone would be very small at 14k, but uniform bias is harder to predict. (Maybe parents with a lot of kids aren't sitting around taking online polls very regularly.)


I think we do not prove causality. It just survives another disproof. That's what just happened.
Agree on the latter point!
One question I have here is why there were so many people in the sample who did not receive the CTC? The sample says "83% not child tax credit recipients". My understanding of the CTC is that it was (essentially) supposed to go to all parents, except for those with very high incomes. Any ideas?
35.2 million families got the first monthly child tax credit in July, per https://www.cnbc.com/2021/07/15/the-first-child-tax-credit-payments-are-out-to-35point2-million-families.html
Thanks! I know there are many people who should be receiving it but aren't for a host of reasons. That does help answer why the sample split was 83/17 in this Data for Progress poll. https://money.yahoo.com/child-tax-credit-payments-are-missing-vulnerable-families-165515979.html
It could be that the poll isn't representative of the share who got the CTC!
Probability of contacting 14,000 individuals and 83% not receiving child tax credits; what if we assume 50% of 35.2 million families ~17 million individuals. .
Well, the probability of being significantly off due to sampling error alone would be very small at 14k, but uniform bias is harder to predict. (Maybe parents with a lot of kids aren't sitting around taking online polls very regularly.)
So, wait - ~17% of the electorate =35.2 million families? Number registered voters 2020 = 168.21 million, per https://www.statista.com/statistics/273743/number-of-registered-voters-in-the-united-states/. 17% of 168.2 M = 28.6 M. 28.6 million individual voters = 35.2 million families?
Their poll says 17% of individual voters are CTC recipients... NOt sure how that translates to families though!