Happy Saturday! I haven’t posted yet this week, so here’s a double edition. My way of saying sorry and I hope you’ll forgive the lapse. I also hope you’ll check out The Economist’s ambitious polling model for Germany’s upcoming parliamentary elections in September, which launched this week and is why I’ve been MIA.
There are two big stories this week. The first is the Senate passing a modified version of Joe Biden’s infrastructure plan. The US gov will spend $1.2trn yo repair and expand highways, bridges, rail transit, and broadband — and on all the jobs necessary to complete these projects. More to the point, the bill is extremely popular:
Monmouth University poll: 70% support the package, 29% oppose (+41)
These margins make it one of the most popular bills passed in decades. (Chart coming on that next week.)
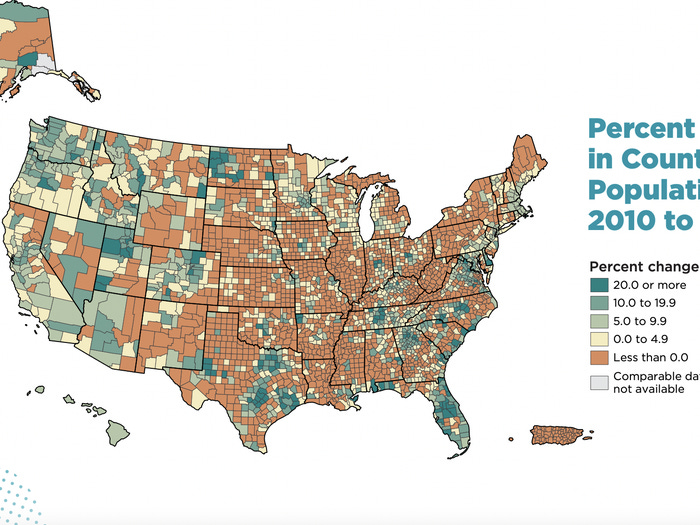
The second big story is the Census Bureau releasing its decennial block-level enumerations of the population by now ace and ethnicity. The topline is that the US population grew by about 8% over the last decade, with most of that growth coming among non-whites. The white population, in fact, shrank from 64 to 58%, according to their calculations, the first-ever decline in the white non-Hispanic share of the population since the first census in 1790.
The share of the population in most rural counties also shrunk by a good margin. Here’s the Census graphic:
There is an obvious political angle to that geographic pattern of population change. The relative redistribution of wealth and population, and thus power, from America’s heartlands to its coastal cities (esp in the South) has been ongoing since the 1980s. What’s new now is that the (mostly white) people being “left behind” by America’s growing metro areas are seeing a corresponding growth in the non-white population all around them.
Sound familiar? Here’s a chart of how counties that gained/lost population (x axis) got more/less Democratic from 2012 to 2020 (y axis):
Over the last decade, counties that have lost population have also gotten more Republican. Correspondingly, counties that have gotten whiter have also gotten more Republican (this isn’t shown here, but I checked it with the magic of statistics). This is all eerily evocative of founding narratives of Trumpism: that growth is making America less white and less nostalgically American. Obviously, I think that’s good, and power ought to roughly shift proportionally to where people are living.
One last thing: I would be missing an opportunity to think like a political psychologist if I didn’t say that the Census’s new data, and news coverage of them, are going to provide us with an opportunity to test how Republicans react to being primed with a real threat to their status.
That’s it for this week. I’ll see you in your inbox again tomorrow.
What would be extremely useful for thinking about demographic changes highlighted by the Census would be to contrast the raw numbers in the various racial groups with the percentage of the electorate these groups contained -- say in 2020. That is -- whites are down to 58 percent of the resident population. In 2020, were whites still over 70 percent of the voting electorate? Etc ...
Good question! I think some people have crunched those data. I can highlight some of them. But, of course, projections about the future are only so useful. One interest Q is what politics would look like if voters were also only 58% white.
Been trying to figure that out in CA for three decades. Voting electorate still majority white I think, though Latinx now a plurality of residents. Age, citizenship are factors. :-) And of course political leanings are monolithic in any community.