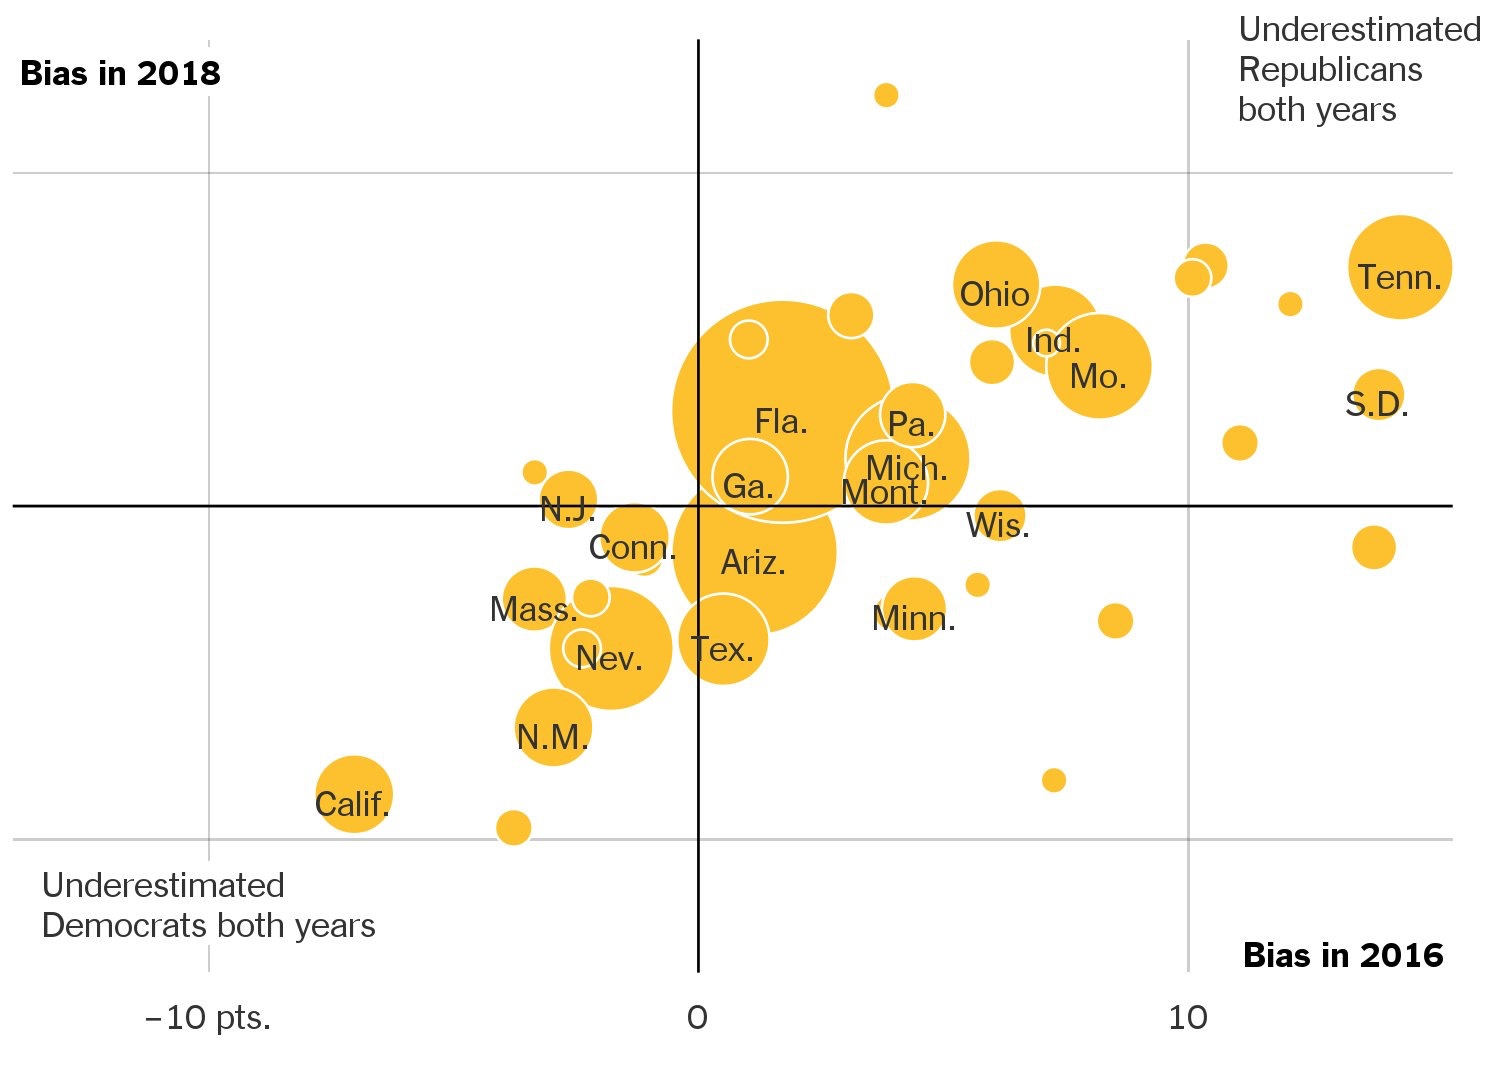
This week marked the federal Labor Day holiday in the US, and with it the unofficial start to campaign season—when polls are said to get more accurate. While that is true historically, you would be forgiven for not trusting pre-election surveys with your whole heart. The last few elections produced nearly nightmare scenarios for the pollsters—that was true in 2016 and 2020, but also 2018, despite some popular myths about the accuracy of polls that year. (See the chart below.)
Chart 1:
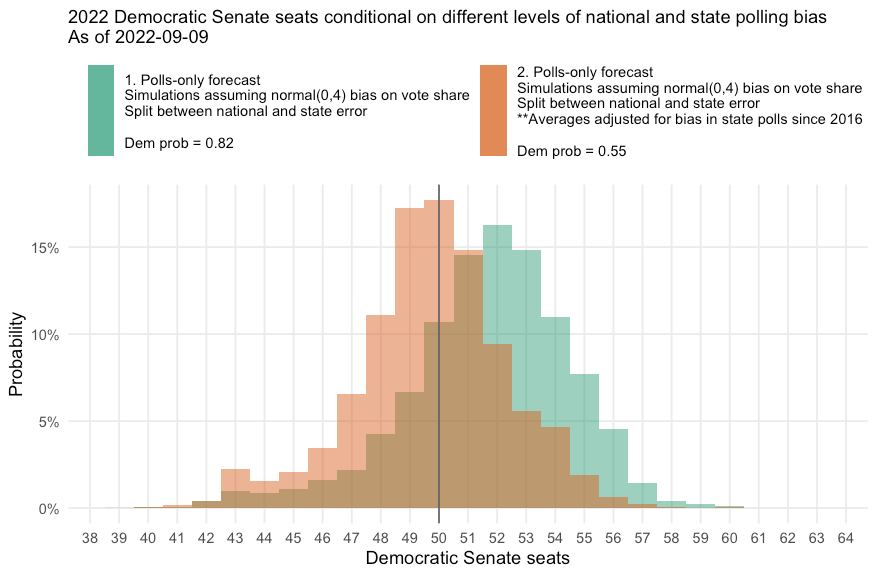
Chart 2:
Given the recent record of industry-wide polling bias, it is justifiable to be skeptical of election predictions again. So this week I set out to answer the question of what the polls would tell us today if they are as wrong as they were, on average, over the last few elections. I focus on the Senate, but we can apply the same lessons to the House.
I did this by building an election-forecasting model based only on the polls. It uses a basic average of polls released in each race weighted based on the recency of the survey and the quality of the polling firm. I do this for every Senate race in every election cycle since 2000. That lets me quantify the accuracy of the method in the past, helping us calibrate expectations for the future.
Specifically, I take the average of polls today and simulate 10,000 hypothetical polling errors according to the historical error of the average of polls at this point in past campaigns. Then I can answer two questions: (1) How many seats do we expect Democrats to win this year if polls are, on average, unbiased? And (2) How many seats do we expect Democrats to win if polls in each state are as biased as they have been since 2016?
The results of these simulations are summarized here:
The upshot is rather obvious: if polls are as biased as they were before, the expected number of Democratic seats falls from 52 to 50. I reported on this for my Economist column this week. But this is also an incomplete answer; it leaves two remaining questions unanswered.
The first question is what happens if polls overestimate Republicans instead of Democrats. That is not a recent occurrence, but it is also not remote; polls underestimated Barack Obama’s margin of victory in most close states in the 2012 presidential election, for example.
The answer may surprise you. While a 2020-level poll bias toward Democrats causes the party to lose 2 expected Senate seats, a bias in the other direction (toward Republicans) only causes their expected number of seats to go up by 1.1. And that is because the party is currently overexposed to losing close seats; in other words, there are more close Republican-held seats that Democrats are favored in than ones where they aren’t.
The other question, though — and one that I reckon is more important — is whether we should expect 2016-2020 levels of polling bias again this year. Have the underlying causes of those errors — chief among them higher Democratic response rates to pollsters — gone away, or are we in the same environment this time around?
I will admit upfront that this is an impossible thing to forecast, and I do not know the answer. But there are some things to think about:
Some high-quality pollsters have moved to probability samples recruited by address-based sampling. This list includes (but is not limited to) the Pew Research Center, CNN/SSRS, and the AP-NORC poll.
More pollsters are adjusting their data to be representative of the likely-voter electorate by demographics as well as political party. This is most commonly done by weighting to an estimate of party composition on the voter file, though some pollsters use more sophisticated methods.
But most pollsters have not changed their methods at all.
The first two things should decrease the chance that high partisan nonresponse throws off the polls again. But do not overlook the third factor. The fact of the matter is that many election pollsters are crossing their fingers and hoping that the issues in polling recently do not rear their ugly heads again. And they may be right — but they may not be.
And that is why I think it is important for us to think about what our aggregates of polls would show conditional on different levels of uniform bias in the polls. We may not be able to predict what that bias will be ahead of time (indeed, unless you the microdata from a poll conducted off the voter file, this is essentially an impossible task — and even then it is both science and art), but we can prepare ourselves for scenarios in which the polls are off again.
The other advantage is, of course, that this formula for reading polling averages is a much better representation of how all the polling industry’s data actually get generated. Pollsters do not conduct their surveys in individual vaccums of their own space; issues affecting response rates and weighting algorithms and partisan composition of responders affect all firms simultaneously (though to varying degrees). This is the biggest thing that smart consumers of polling data can learn this year.
Control of state government post dobbs appears important but little discussed. What's of particular interest to me is whether a surge in pro-choice involvement in gerrymandered purple states is likely to have an effect on control of the legislature. What sort of data and models are you aware of?
I'm struggling with how to react to polls from Trafalgar this cycle. It seems like many on Twitter are treating the Trafalgar polls as the "most accurate" now because they were less biased towards Dems in previous cycles (I know it depends on the state, but that's the narrative).
I know the answer is usually just "throw them in the average", but how are you dealing with polls from Trafalgar?
(I could also include Rasmussen in this too. They are consistently showing some of the highest approval ratings for Biden)
We need to know if the pro-Dem polling bias is an artifact of method or deliberate manipulation. That polls tend to skew towards one party suggests the latter explanation: deliberate manipulation to skew the results. We know about the Bradley Effect, and the Shy Trumpsters who are very hard to reach. But a few pollsters have addressed this problem (e.g., Trafalgar) while others haven't. Therefore I expect the pro-Dem bias to persist this year and to continue until all pollsters address the response rate problem. Why some pollsters prefer persistent bias over accuracy is a different topic.


Control of state government post dobbs appears important but little discussed. What's of particular interest to me is whether a surge in pro-choice involvement in gerrymandered purple states is likely to have an effect on control of the legislature. What sort of data and models are you aware of?
Factor in increased numbers of voter registrations ?
I'm struggling with how to react to polls from Trafalgar this cycle. It seems like many on Twitter are treating the Trafalgar polls as the "most accurate" now because they were less biased towards Dems in previous cycles (I know it depends on the state, but that's the narrative).
I know the answer is usually just "throw them in the average", but how are you dealing with polls from Trafalgar?
(I could also include Rasmussen in this too. They are consistently showing some of the highest approval ratings for Biden)
We need to know if the pro-Dem polling bias is an artifact of method or deliberate manipulation. That polls tend to skew towards one party suggests the latter explanation: deliberate manipulation to skew the results. We know about the Bradley Effect, and the Shy Trumpsters who are very hard to reach. But a few pollsters have addressed this problem (e.g., Trafalgar) while others haven't. Therefore I expect the pro-Dem bias to persist this year and to continue until all pollsters address the response rate problem. Why some pollsters prefer persistent bias over accuracy is a different topic.