How popular are progressive policies, really?
There are several reasons to think polls might overestimate support for left-leaning opinions
Happy Saturday evening, all. I wanted to write this post sooner, but am about 10,000 words away from wrapping up my book and am plowing full-speed ahead to finish by my deadline on February 28th. At any rate, the added time has probably improved this post, so you're welcome.
I have written before about whether we can trust public opinion polls of policy preferences — called "issue polls" in the survey industry — given that pre-election polls appear to be demonstrably and continuously biased against Republicans, at least on average (IE not in all geographies or in all races or in all years — I feel like I have to say that to avoid emails where people say "umm, actually, the polls in Georgia were pretty good this year!").
Editor’s Note: This is a paid post for premium subscribers. If you are a subscriber and have friends or family that you think might learn something from this post, you should feel open to forward it to them regardless of their membership status. But if you have been graciously sent this post by a friend that subscribes, please consider signing up for updates yourself by hitting the button below!
My conclusions before have been that, yeah, we can roughly trust the numbers from issue polls. I still think that's true, but there are some notable exceptions to the rule that might make a lot of liberal policy positions look more popular than they are. We also need to talk about the utility of asking about support for liberal policy preferences among all adults instead of among the citizen voting population, at least if we're thinking about what all this polling actually means for representation.
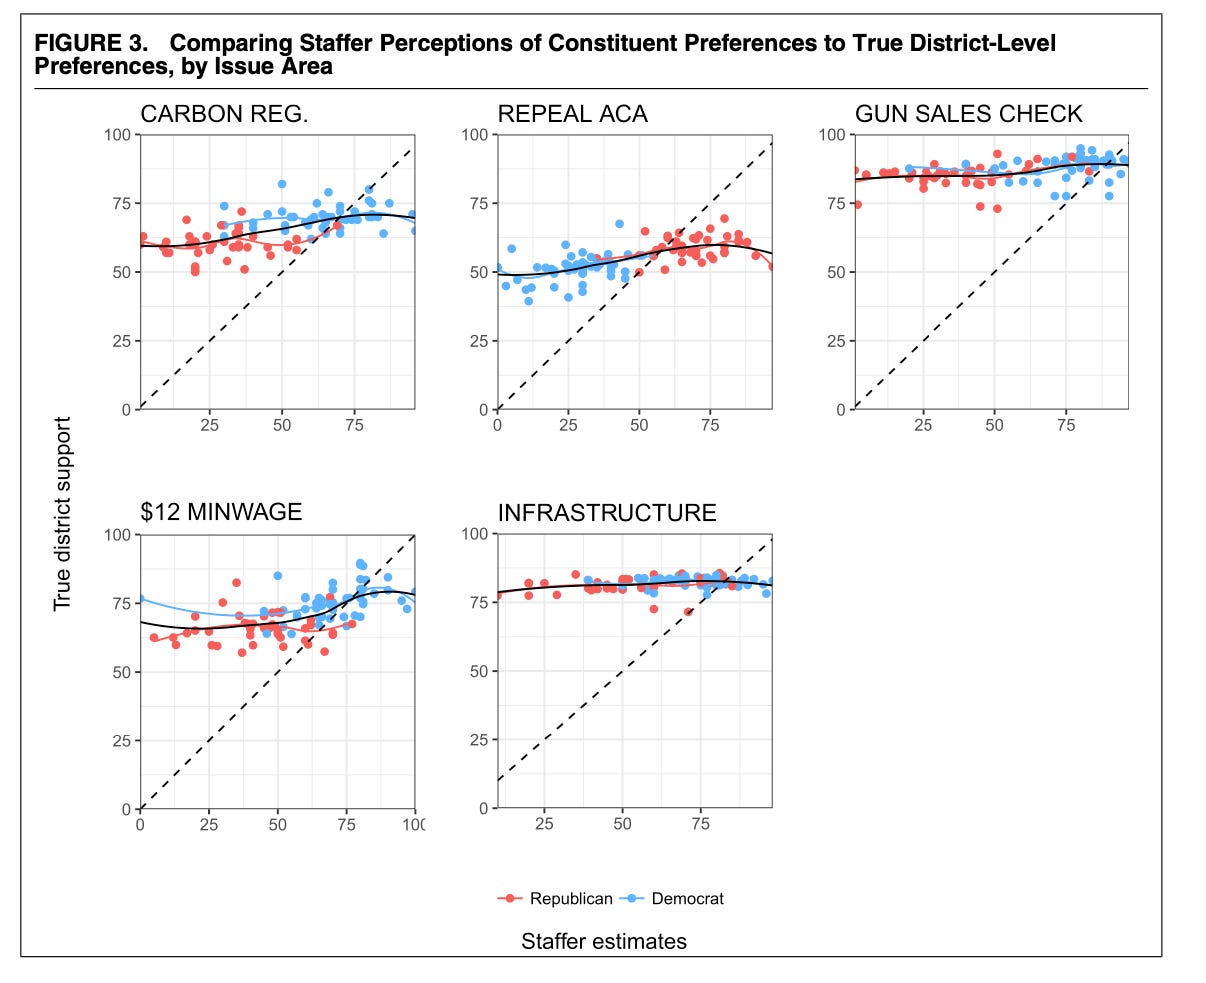
I was reminded to post about this topic when I saw a recent Twitter debate about this recent American Political Science Review article that claims Congressional staffers routinely overestimate support for conservative policies among the constituents in their home districts. I think this is probably true, but take a look at the graph below and ask yourselves if you really think the mismatch is as severe as the study makes it seem:
The study, which I think is actually really great, has come up with estimates of "true" district support for five different issues and compared them to a survey of estimated district support from legislative staffers in the US House. They estimate that, in some districts, there is upwards of an 80-90 percentage-point mismatch in the actual and estimated share of voters who approve of gun sales, and a 50-point one in the share of people who want to repeal the Affordable Care Act. Maybe that's true, but what if their estimates — which are based on data from a large academic Internet poll run on YouGov's opt-in panel — are just biased?
Consider that issue polling probably runs into a lot of the same problems of non-response and sampling bias that pre-election polls do today. This could include:
Population differences: Internet panels have been shown to survey populations that are much more engaged in politics than the average person. What if support for some of these liberal policies is correlated to political engagement?
Non-response bias: For a poll fielded with random-digit-dialing, a pollster might have a lot of trouble coming up with survey weights that correlate both to non-response and voters' opinions. Maybe RDD polls are reaching demographically-representative samples of Americans (or at least representative enough to be fixed with standard weights) but aren't otherwise representative of true opinion. Maybe the people who oppose gun background checks aren't answering their phones for the same underlying ideological reasons, but we're not weighting on a variable that captures that. A poll fielded off the voter file (we call these "RBS" polls for "registration-based sampling") could be a better alternative for salient policies that have mapped onto the liberal/conservative divide, but will still be weak for non-polarized opinions — perhaps on infrastructure spending or carbon taxes, which few people really understand anyway.
Model robustness: The specific "polling" data we're looking at above was generated by running a statistical algorithm called "multi-level regression and post-stratification" (MRP) on a large national survey fielded online. As someone who does MRP with high-quality panel data, regularly, I can say certainly that writing a model that will actually generate politically and ideologically-representative estimates at the subnational level is very, very hard. For example, my MRP estimates for the 2020 election had Biden up 6 points in Georgia, and that was after weighting on over 380,000 combinations of race, age, sex, education, religion, 2016 vote, region, and state. I don't see the researchers' algorithm, but I doubt it was that sophisticated — and even if it was, it would probably still be biased toward the liberal opinion.
I'm not saying that this study is useless but proposing that maybe the congruence in opinion is closer than we think.
Consider further that we have results from several ballot initiatives that suggest that issue polls are probably biased toward liberal opinions — perhaps not by a lot, but certainly more than a little. Take Nevada's 2016 vote over background checks for gun purchases as an example. The option to expand background checks to almost all gun sales other temporary and familial transfers only passed by one percentage point. If the average national support for universal background checks was about 85% as the above study suggests, wouldn't the Nevada expansion have passed by a much wider margin? Nevada is only slightly redder than the nation as a whole in presidential elections, so maybe it should have been 80-20 in favor of expanded checks on gun sales. Even if you consider that the average adult opinion is different from the population of voters that ended up turning out in 2016, do we think they are 30 percentage-points different? I don't. Most polls of Trump's approval rating only had a 2-3 point difference between the adult and voter populations.
On the other hand, I am open to the argument that ballot initiatives might be a horrible benchmark for gauging the accuracy of issue polls. Not all people participate in them, perhaps decreasing support for liberal policies already (if you think that non-voters are more likely to vote for Democrats). But then you have to consider the power of interest groups, outside money, and organizing on support for the policies. I would listen to someone who said that ballot initiatives inherently discount support for liberal opinions. Let's say that bias is 5 percentage points on the share of people supporting background checks.
Even then, we might have suspected a full-population ballot initiative in Nevada to end with 56% of people voting for expanded background checks and 44% against. That's a long way from the 80-20 we're expecting based on the online polling MRP. If you believe that the poll is ten points biased toward liberal opinions, and ballot initiatives are ten points biased toward conservative opinions, then we're still at a ten-point mismatch between the share of adult Nevadans we think to favor expanded background checks (70%) and the share who "voted" for it (60%).
So, I think the hypothesis that issue polls are at least high-single-digits biased toward the liberal opinion is worth entertaining as our prior.
...
Here are some other considerations:
Electoral evidence: Why would Republicans have gained House seats in the 2020 elections if support for the policies of the Democratic majority was really around 60-70% on average? Isn't the counter-counter that staffers and politicians might know more about their constituents than the pollsters at least as valid as the other way around (in the specific context of this study)?
Who's hanging up the phone? The population of people that pollsters can't reach is typically more disengaged from politics, which probably leaves them open to elite opinion leadership once they do tune-in to an issue. That would probably push opinion back toward the 50-50 mark since a crude estimate is that Democratic and Republican leaned party identification hovers around 48% and 45% respectively when people are engaged (IE in November of presidential election years).
Question-wording: Polls written by mostly-liberal college graduates living on the coasts might unconsciously be slanted a bit toward Democrats. Even if outright bias isn't a factor, there is typically a mismatch between the wording on polls and wording on ballot initiatives and referenda, which makes this whole exercise a bit harder.
What's the utility of polling all adults? Usually, people like me who believe polls are a good check on the counter-majoritarian influences of interest groups and our electoral system say that public opinion surveys are one of the only tools that people have advocating on their behalf in Washington. After all, the government is supposed to represent all persons regardless of whether they vote or have people championing their causes in DC. However, when we're comparing how good legislators and staffers are at guessing the opinions of their district, should we be focusing on the group of people that they hear from most — either at the phones in their offices or on elections days?
...
After thinking through all this, I think that it's reasonable for political leaders to expect that polls overstate support for liberal opinions, at least by a little — and maybe by a lot. Of course, public opinion polls are still useful, but we should make these mental adjustments in our head when evaluating them.


