


How increasing education polarization could help Democrats in the 2022 midterms
Republicans' rising reliance on low-propensity voters who don't have college degrees could hurt them in lower-turnout elections

Hey, did you hear? There was a special election for New Mexico’s First Congressional district three days ago. This post misses that news a bit, but offers one potential explanation for the Democratic candidate’s victory and prognosticates about what it could mean for 2022.
But first, a brief recap: The Democratic candidate Melanie Stansbury beat the Republican 60.3% to 35.7%, a margin of 24 points. That turns out to be an 8 percentage point swing on margin since the 2016 election,\ when then-Representative Deb Haaland beat the Republican candidate by 16 points and lagged Biden’s 23-point margin versus Trump in the district. (The seat was up for a special election in the first place because Haaland resigned from her post to be appointed Secretary of the Interior).
Forgive the numbers dump. The point is that Stansbury did anywhere from 1 to 8 percentage points better than we should have expected based on last year’s results, depending on whether you pick the previous House margin or Biden’s presidential margin as the baseline. This runs counter to our expectations of the political environment based on electoral history. Most of the time after a party wins the presidency, that party tends to lose ground in special elections — just like Democrats did in the special elections to fill House seats in Texas (the 6th district) and Lousiana (the 5th) earlier this spring. On average, special elections to Congress since 2020 show the electoral environment getting one point more Republican. If you look at special elections to state legislatures, too, the average swing is two points towards the Democrats.
To be sure, this could all be a fluke. Special election results are very noisy indicators. There are several reasons why: turnout tends to be low, magnifying differences in vote shares due to dropoff among relatively small numbers of voters; there can be wider-than-usual discrepancies in candidate quality, especially in otherwise uncompetitive seats; and parties don’t tend to invest in each race. Just to name a few.
However, if the trend is real, it helps to understand why. Some clues hide in the neglected relationship between demographics and the results of the US House elections in 2022.
Education is correlated with both turnout and (now) voting for Democrats
The long-term problem Republicans face is that their vote share has risen among voters without college educations, especially whites, at the same time as that group of voters has been shrinking. This is a particular vulnerability in midterm elections, when turnout among non-college-educated voters, who have lower probabilities of voting than college-educated voters, sags by larger amounts than degree-holders relative to presidential years. Increasing your vote share among voters with lower vote propensities, in other words, leaves you vulnerable in elections in which they don’t bother to show up.
Here is the relative chart for turnout rates among college-educated and non-college-educated voters:

And this chart shows increasing education polarization in US House vote among both white voters and non-white voters:
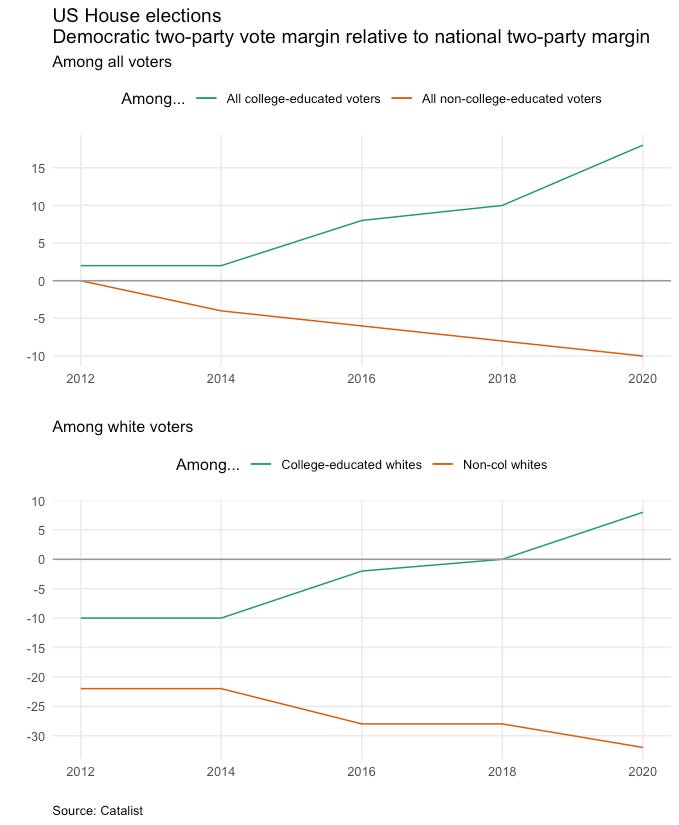
Combining them, we see that voter turnout is lowest among the most pro-Republican groups, and highest among the groups that favor Democrats.
This all means that Republicans could be hung out to dry by non-college-educated voters (especially whites!) who Donald Trump managed to engage in 2020, but who aren’t regular mid-term voters. And perhaps that’s why Democrats won the NM-01 special by a larger margin than they did in 2020.
Let’s talk relativity
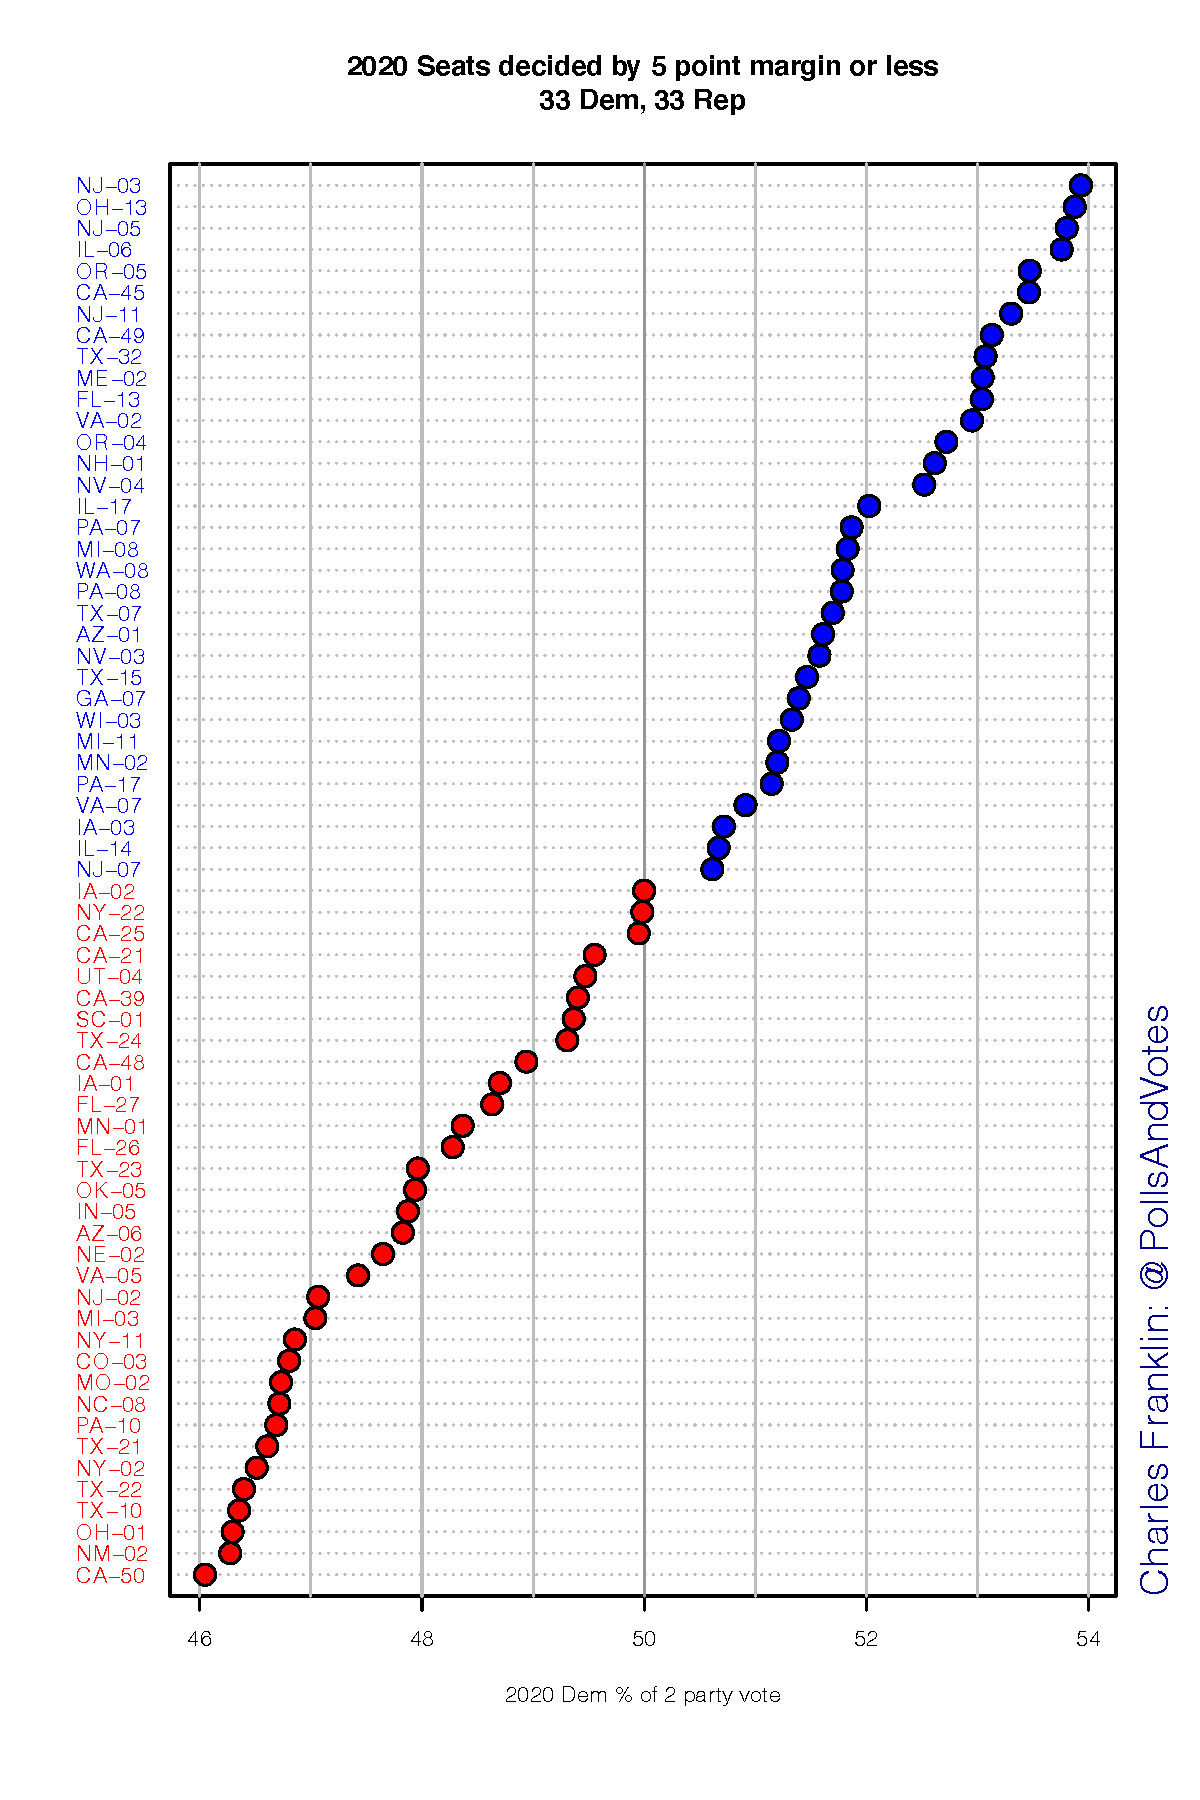
It is important to note that the effects of turnout on Democrats’ chances of holding the House and Senate in 2020 are relative to all the other forces pulling on the national political environment. In fact, I still think Republicans are clearly favoured to win control of Congress next year. A naive model predicting Democrats’ national vote share factoring in the usual midterm penalty for the party in power suggests they’ll win about 48% of the two-party House vote next year, a swing of 3 percentage points on vote share. That would be enough to wipe out their House and Senate majorities; for the House, a decent guess is to take all of the blue seats between the 50 and 52% lines below and make them red:
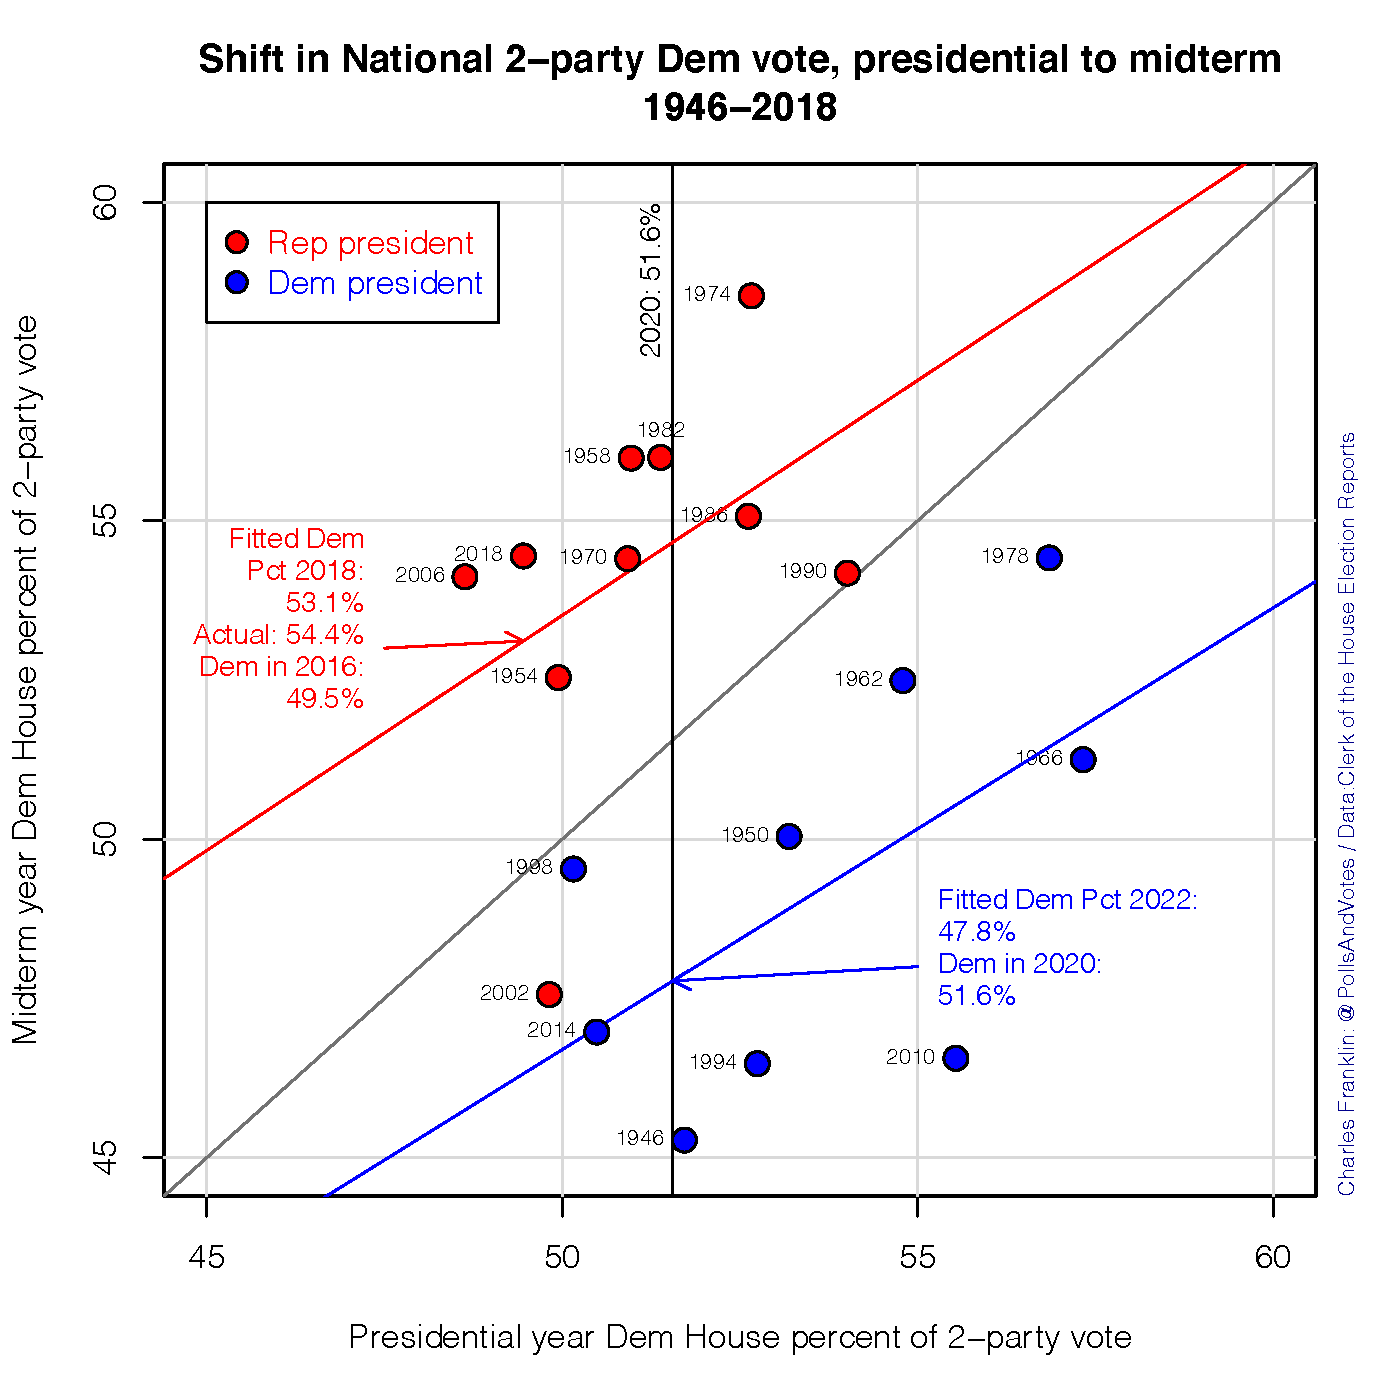
Yet that naive model has a pretty wide confidence interval. Based on the variance in the historical relationship between presidential-year House vote share and subsequent midterm results, Democrats could win as much as 54% of the vote. So they’re still in the game. (Note that because of the geographic bias in the House, Democrats need to win the House popular vote by about 2.5-3 points to win the majority. That’s 51.5% of the two-party vote, 52% to be safe). Here’s that model, and the uncertainty, in graphical form, courtesy of Charles Franklin:
Joe Biden’s 54% approval rating paints a similarly bad picture for Democrats:

Explanation, not prediction
The midterm penalty is not a sure thing, but it’s as close as you can come to the laws of physics in electoral politics.
Accordingly, these inferences about party coalitions and turnout are not predictions of the average midterm result. Instead, they explain error; What we glean from these data is why Congressional election results in 2022 might be above or below expectations — why the Democrats’ vote shares might land above the trend lines in the graphs above.
The takeaway is this: Based on the relationship between demographics, turnout, and Democratic vote share we can hypothesize that, if the Democrats do hold onto their House majorities, they will have increasing margins among college-educated voters to thank.
If we take the presidential year congressional vote as a proxy or estimate for what we expect the next midterm vote to be, we might want to correct for forces peculiar to the presidential year, usually those associated with the presidential election. Removing those would provide a better estimate of what the midterm vote would be if nothing unusual happened. There are a number of possible ways of removing the presidential influence, e.g., estimating how much of a net drag JFK was on the Democratic ticket in 1960 or Goldwater was on the Republican ticket in 1964. The best ones would presumably improve the fit of the regression lines of midterm on prior congressional vote split.
Very helpful. For the chart on the shift from presidential to midterm vote, what happens if you factor in presidential vote? At first glance, it appears that when Democrat presidents lead the ticket, their absence is sorely missed two years later, while when they drag the ticket while being elected, Dems bounce back well.