


Ungated: Are the polls tightening? AKA how to read aggregates like a pro.
Five questions to ask yourself when it looks like the race might be shifting

This is an ungated copy of subscribers-only content for my newsletter, made public because I think the topic is important for a wide audience. Subscribe to more below:
Friends,
As we move toward election day and the fall campaign really heats up, we’re going to see more and more coverage of the horse race. Some of it won’t be very good. Right now, a dominant narrative floating around among pundits is that the race has tightened significantly over the last month.
It might be true, but there are plenty of reasons to be skeptical of this.
Elliott
Real Clear Politics has been publishing an aggregate of presidential election polls for more than a decade now. That has bought it some credibility among people who watch politics for a living, but I’m not really on board with it. They have seemingly arbitrary rules for which polls they include, when they include them, and how long to keep them in their average if they do.
My main complaint is that RCP also violates a lot of underlying statistical rules about time series data, not least of them accounting for intermittent changes in the biases of your data. Because they don’t account for the cadence of releases from high- and low-quality pollsters, the RCP average is kind of like an experiment where you’re measuring how many carp and bass are in a pond on any given day, and then one day you fish all the carp out of the pond but pretend as if nothing has happened
Nevertheless, I am but one voice and the chorus has decided that RCP might be right and Donald Trump has gained considerable ground over Joe Biden during the last few weeks. After all, how could this line lie?
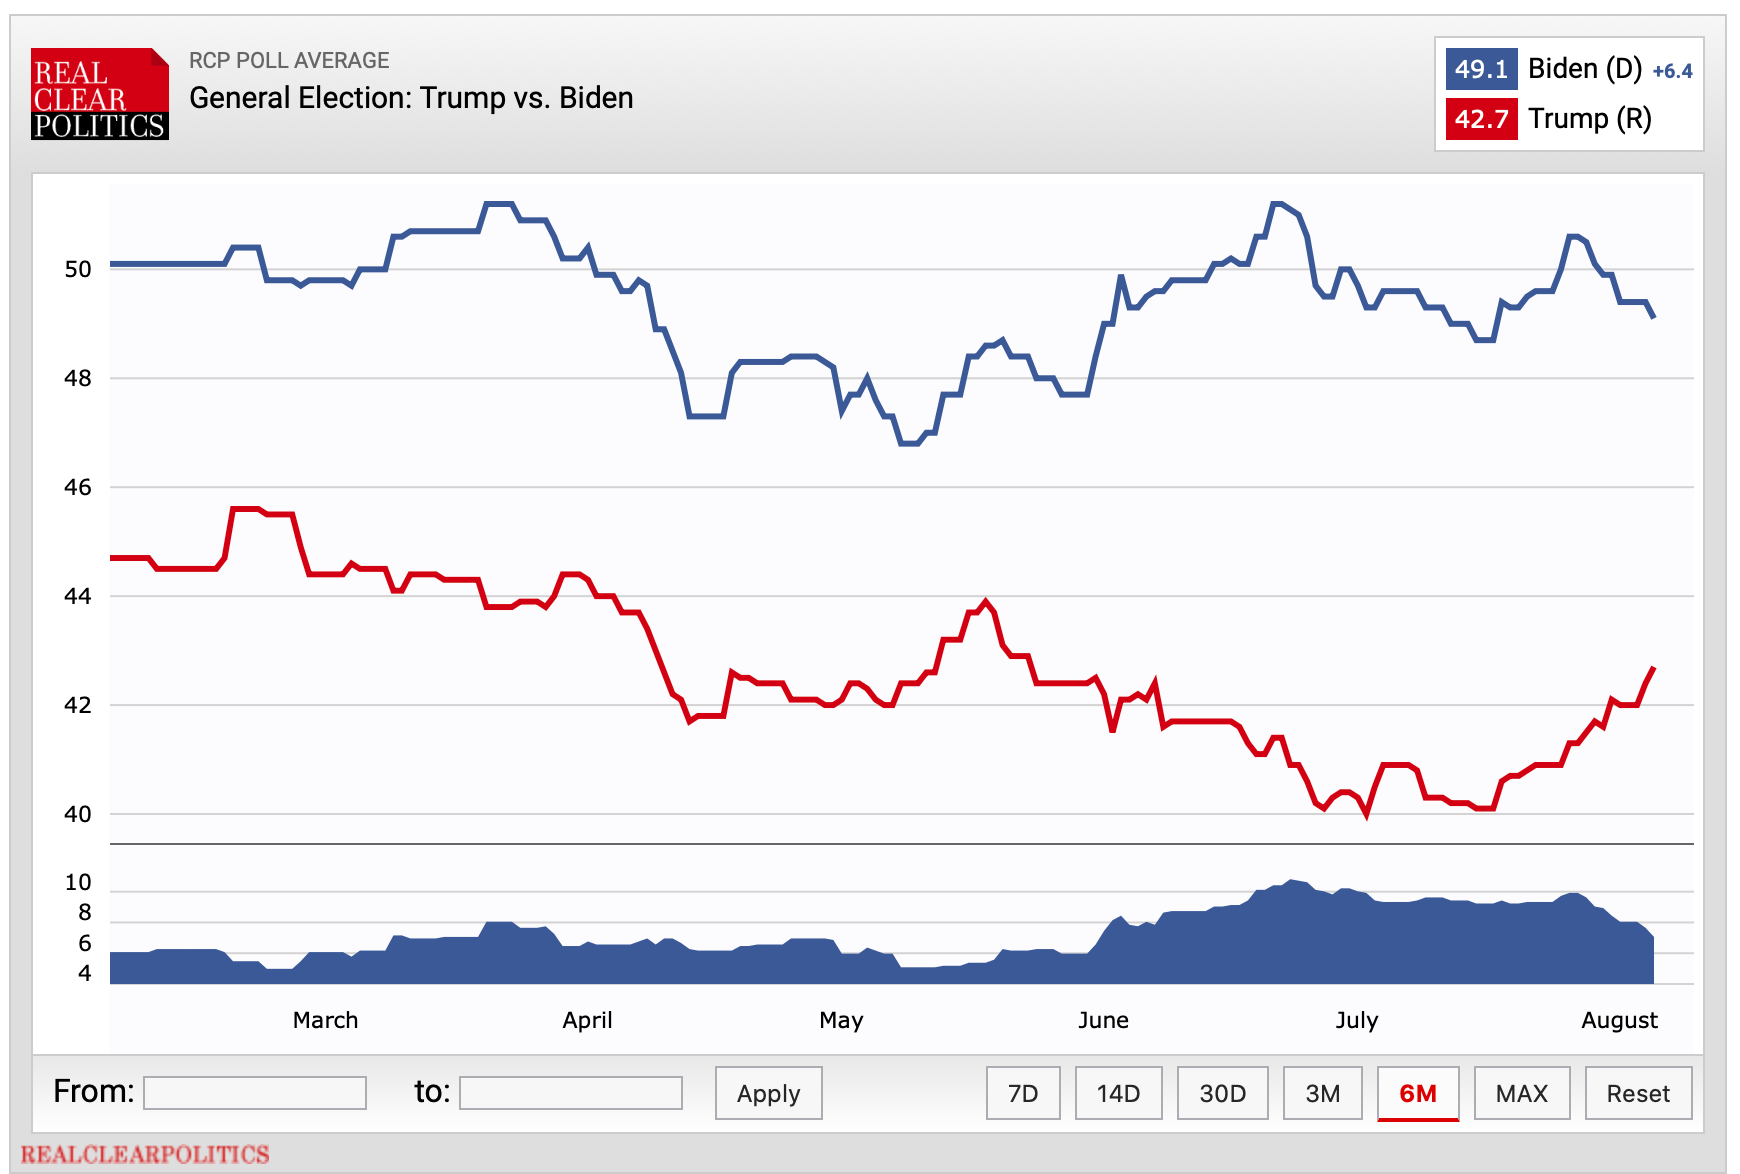
Actually, “how could this chart lie?” is a great question to ask yourself! And to answer it, I present five additional questions below to ask yourself when people are shouting “THE POLLS ARE TIGHTENING THE POLLS ARE TIGHTENING!!”
But before we get there, these questions are conditional on you looking at averages of polls instead of individual ones. If you’re not, that’s a good thing to fix now before the campaign really gets going. FiveThirtyEight has a pretty smart average of national polls that remedies many of the issues with RCP. The Economist has a model that uses both state and national polls in its popular vote estimates, which is cool. You get the idea.
How many new polls are there? Because polls are just samples of a larger population, they tend to bounce around a bit even if the underlying sentiment of the electorate doesn’t change. Of course, that’s the whole idea behind averaging, but without a sufficient number of data points you’re going to get a pretty jumpy estimate. If an aggregate only has two or three new polls in it it’s probably not enough to conclude that a trend is real.
Are the polls from a diverse and steady group of pollsters? Another thing that can cause phantom swings in polling averages is if the underlying data become suddenly dominated by a polling firm, or group of firms, that either (a) hasn’t released data in a while or (b) is usually accompanied by other polls, but for some reason right now isn’t. Refer to the RealClearPolitics average right now and you will see that it is excluding all of the high-quality, live-caller phone polls released over the last month and has included new data from three IVR pollsters generally considered to be subpar: Rasmussen, HarrisX and Emerson College. As discussed earlier with the fish example, that’s a no-no.
Does the aggregate control for things like mode and population effects? Pollster effects? Related to #2, one way to depress the impacts from the cadence of pollsters’ release schedules is to adjust pollsters’ estimates for persistent biases caused by flukes in data-collection or number-crunching processes. If all the polls fielded online seem to suggest Democrats are doing 5-10 points better than polls from the other modes, maybe there’s something wrong with online surveys. If robo-polls are all right-leaning, could that be caused by the fact that they call landlines and skew older and whiter? Even after taking that into account, a firm might have biases because of the way they phrase questions or conduct their sampling frame. A good aggregate can adjust for these factors. That doesn’t get you entirely out of the woods, but it helps.
Is there a big event that could have caused the change? Now we move on to the practical explanations for movement. Quite obviously, changes in aggregate support for a candidate is more likely to change after a large, newsworthy event that falls outside the normal partisan discourse of an election. If you start seeing a bunch of swings in polling averages when nothing has happened in the news, maybe you should second guess whether it’s real.
How far away is the election? This is a question to consider even if a swing in the polls is real rather than phantom. If the election is three months away, a slight drift up or down shouldn’t change your probabilistic expectations for November very much. That’s because there is plenty of time for the change to revert. But three weeks before an election is a different story.
I will not pretend that I have completely removed my personal biases from this post. I believe in an American public that is politically hard-headed, especially when it comes to elections. Only on rare occasions do people change their minds en masse. As a result, I view most temporal oscillations in polling average as temporary artifacts of external forces, such as which pollsters release data, etc as mentioned above. I certainly feel that the data justify this belief, but you should know the underlying premise on which I’m operating.