


The Crosstab Weekly Newsletter 📊 November 11, 2018
What happened in the midterms? Scatterplots galore!

Welcome! I’m G. Elliott Morris, data journalist at The Economistand blogger of polls, elections, and political science. Happy Sunday! Here’s my weekly newsletter with links to what I’ve been reading and writing that puts the news in context with public opinion polls, political science, other data (some “big,” some small) and looks briefly at the week ahead. Let’s jump right in! Feedback? Drop me a line or just respond to this email.
This newsletter is made possible by supporters on Patreon. A special thanks to those who pledge the top two tiers is written in the endnotes. If you enjoy my personal newsletter and want it to continue, consider a monthly subscription for early access and regular blogging for just $2.
This Week's Big Question
So, what happened in the midterms?
Brief inferences about the midterms: Democrats won control of the House by flipping at least 36 seats, but lost key Senate contests in very red states. Democratic turnout for House races was disproportionately higher versus 2016 in rural America, particularly the parts that voted for Trump, but it’s unclear if this represents a permanent or temporary break in geographic polarization in America (or even a break at all). The fact that white, college-educated, suburban districts swung back toward Republicans muddies the picture of Democratic gains and suggests an electoral reversion to pre-Trump politics.
Still, Republicans lost a lot of voters — either from a failure to mobilize them, or a conversion of their real preferences to the other side of their aisle — all over the map, with less clear relationships emerging between political and geographic lines. It’s possible that all Democrats really won was the turnout game. Further, compared to 2012, Democrats have still lost voters in Midwestern states like Iowa, Ohio, Wisconsin and Michigan that are key to presidential politics, and drop-off in the rural south is bad news for Dems. What we see at this point, with the vast majority of votes counted, is a clear pattern whereby Democrats made gains in a lot of Obama-Trump districts, and enough elsewhere to win the house, but we have to know a bit more to know for what that might portend in broader politics.
Think this is too short? That’s intentional; more is coming soon. For more, see the scatter plots below, and keep your eyes peeled for something from me later this week.

Democrats gained voters vs 2016 in areas where Clinton performed worse...

... but there's no clear relationship for Republican turnout...

... & the GOP matched Dem. turnout in cities, causing declines vs Clinton's share.
Political Data
… the overwhelming trend on Tuesday was a blue shift: 317 districts swung to the left.
What Happened Last Tuesday: Part 1 — Who Actually Voted?
Last week, I shared the news that we at Catalist have developed a new methodology for more accurately capturing the true shape of an electorate, almost immediately following Election Day. Today, we’re pleased to share a first look at the story told by this new data.
How contested House districts shifted from 2016 to 2018
To the frustration of people who enjoy neatness, considering one election in relation to another is never as clean as one might like.
www.washingtonpost.com • Share
The 2018 Map Looked A Lot Like 2012 … And That Got Me Thinking About 2020
With Democrats having won the House but not the Senate on Tuesday — and with President Trump still in the White House — we’re headed for two years of divided government.
Why You Should Trust the Polls
Every political data analyst has been asked that same question over and over since the 2016 election. Prior to Election Day 2016, many people watched the coverage and concluded that the polls ruled out a Trump win and signaled clearly that Hillary Clinton would be president.
www.weeklystandard.com • Share
Everything you want to know about the 2018 midterm House elections in 8 charts
You’re well aware the 2018 midterm elections took place, but you probably weren’t nuts enough to stay up to see the almost final results. Luckily for you, we were and we did. Here’s what happened.
Suburban districts moved toward Democrats in 2018
The suburban shift toward the Democrats helps explain why they’re about to take control of the House. This graphic shows the shift — and it shows that even the deep-red rural districts elected Republicans with smaller margins than in 2016.
We’re nearly two decades into the 21st century, so why is America still operating with a House of Representatives built for the start of the 20th?
This is the second in a two-part series on how to make the House of Representatives more representative. Read part one here. Last Tuesday, Dan Donovan, the Republican congressman from Staten Island, lost his seat to his Democratic opponent, Max Rose.
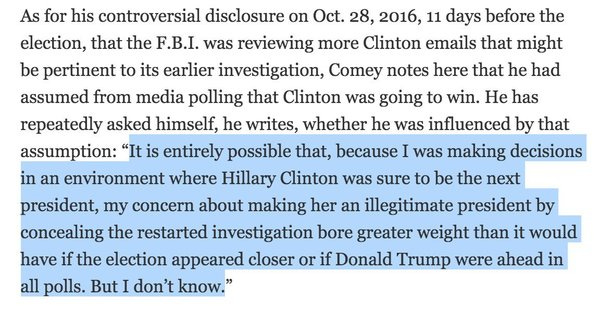
Thread: 1/ Election predictions have consequences—for voters AND officials. With @Comey’s book we see that confidence in a @HillaryClinton victory may have influenced decision to reveal FBI investigation into emails in final days of campaign. H/T @ylelkes, @gdebenedetti https://t.co/ren9l3uAxG
10:39 AM - 13 Apr 2018
What Did They Run On? Winning Issues in 2018 Midterm Advertising
The dust is settling on Tuesday’s midterms, and narratives are already forming about what led to the Democrats reclaiming control of the House of Representatives.
www.deeprootanalytics.com • Share
Republicans Dominate State Politics. But Democrats Made a Dent This Year. - The New York Times
After a generation of steady losses, Democrats picked up seven state legislative chambers and seven governor’s mansions.
Why Democrats’ Gain Was More Impressive Than It Appears - The New York Times
They are poised to win more seats this year than they did in 2006, despite far fewer opportunities.
Other Data and Cool Work
Which countries are most likely to fight wars? - No man’s land
WHEN THE first world war ended on November 11th 1918, David Lloyd George, Britain’s prime minister, told Parliament: “I hope we may say that thus, this fateful morning, came to an end all wars.” History proved him wrong. But 100 years on, the world is far more peaceful.
Amazon HQ2: Why NYC and D.C. Make Sense to Jeff Bezos - CityLab
In splitting HQ2, Amazon gains a presence in New York, which has the largest number of corporate headquarters, and greater Washington, D.C., which is fast gaining as a popular site for a corporate base.
Political Science and Survey Research
Here's How Polling Has Changed Since 2016
When Hillary Clinton lost the presidential election in 2016, public trust in election polling ― which systematically overstated her standing in key states ― took a hit as well. Heading into the next election, many voters and pundits are still feeling apprehensive.
www.huffingtonpost.com • Share
Two Journal of Economic Perspectives articles on predicting the effects of the Republican tax cut from Auerbach & Slemrod:
https://t.co/eG7uYngbgn
9:50 AM - 8 Nov 2018
Using MRP with voter file data; new paper on 2012 claims inferences are stable & reasonable down to demographic subgroups within small geographies like counties & congressional districts:
https://t.co/IPc9vowVRv
11:16 PM - 5 Nov 2018
What I'm Reading and Working On
Now that we’re post election, I’m going to take a short break from politics reading and divRon Chernow’s biography of Ulysses S. Grant, Grant. I’ve read his past biographies of George Washington and Alexander Hamilton, which were fantastic and I’d also recommend.
Thanks!
Thanks for reading. I’ll be back again next week! In the meantime, follow me online or reach out via email. I’d love to hear from you!
A Special Thank-you Note to Patrons
My weekly newsletter is supported by generous patrons who give monthly to my blog, including these individuals who have pledged especially charitable contributions:
Michael Michael Michelle Mike Mike Monty Morris Nadia Nathan Nicholas Nicholas Paula Robert Robert Ryder Sam Sara Sen Shankar Spenser Stepan Stephanie Steve Steve Steve Suzanne
Sydney Taegan Tamara Tera TheMidpod Thomas Thomas Timothy Todd Tom Tri Tyler Matt Spain Andrew Ben Bob Brett Charles Chelle
Like the newsletter and want to help keep it going? Subscribe today on Patreon for access to private posts and other perks.