The 2022 midterms were decided on November 3, 2020 | No. 184 – February 20, 2022
(OK, I guess technically the right date is November 7th — when the presidential election was called by the news networks)
Several recent #hottakes (and some actually good articles!) have got me thinking about midterm elections again.
I have seen claims that mask mandates are powering a “revolution” against the Democrats, who are actively “woke-ing themselves” out of their seats. For their part, the left seems to be arguing that they should pass big policies that fund social programs and safety nets — at best, the rationality goes, this could win them extra votes from working-class white Americans; at worst it would help a lot of people. And there were several articles last week arguing that the Democratic brand has grown so toxic in rural areas that the party faces “extinction” outside of the cities.
But when it comes to midterms, all of these explanations are missing something crucial about voter behavior. Political science tells us that the outcome of the 2022 midterms was effectively decided on November 3, 2020, when Democrats won control of the White House.
What you missed in political science class
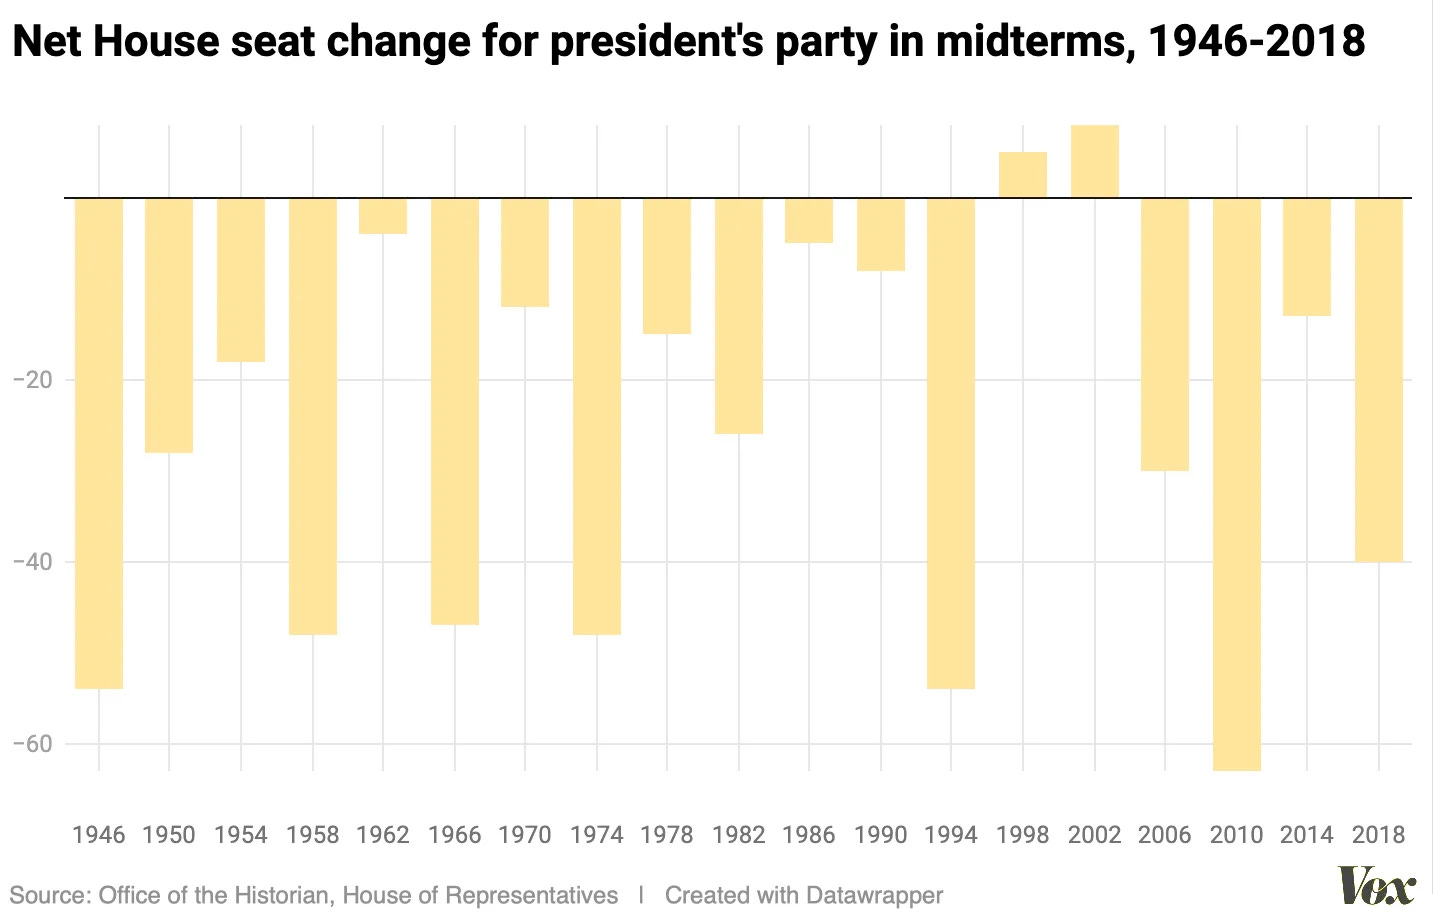
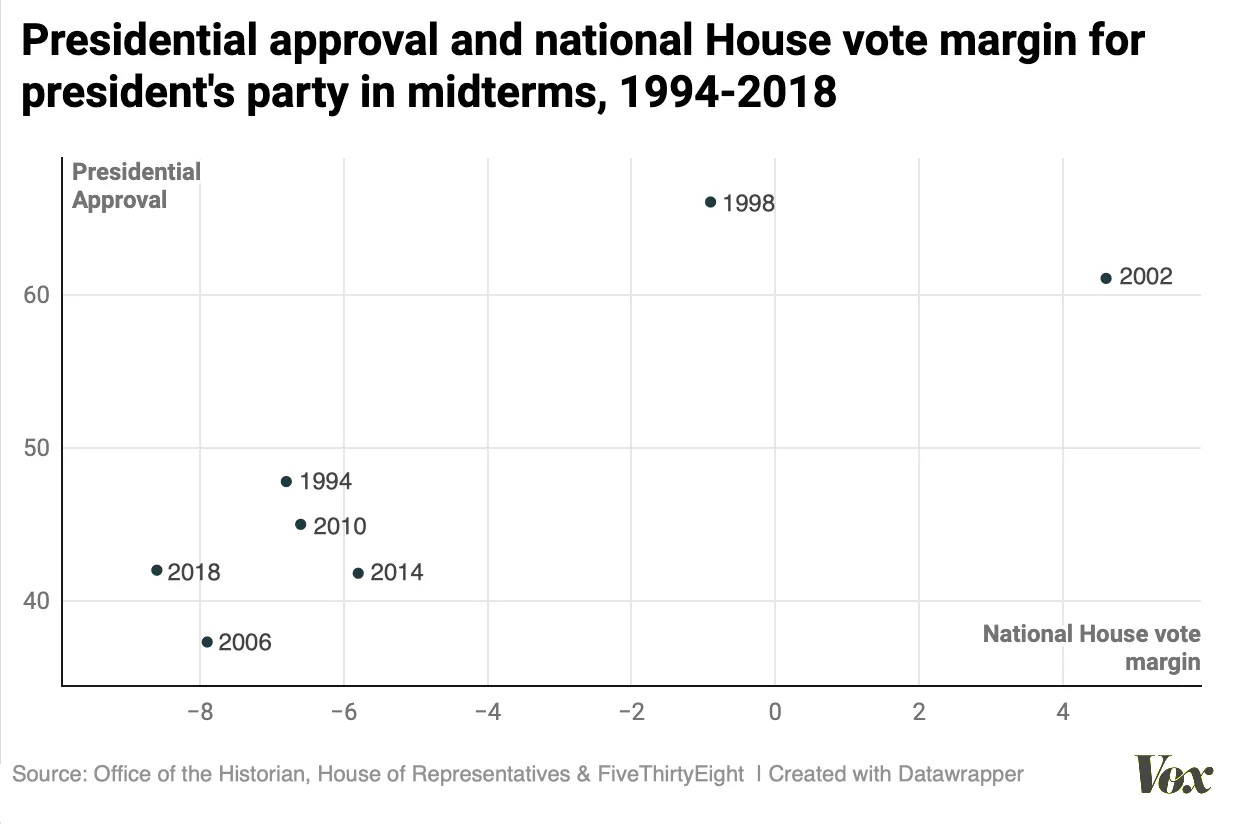
First, consider the history. The president’s party has lost seats in the House in 17 of the 19 midterm elections since 1946 (the only exceptions were 1998 and 2002). The average loss over that time period is 28 seats. Since Democrats currently control 222 seats, they can afford to lose four and retain the majority. (On the Senate side, the average seat loss is 4 seats, where Democrats cannot afford to lose any.) Here is a great chart from Vox’s Andrew Prokop:
This is an extremely durable pattern. That the party in power loses control of Congress in their first midterms is as close as we come in politics to the laws of physics. But what explains the pattern? Let’s now turn to the social science.
The most basic finding in the literature is that voters punish the party in power simply for controlling the White House. Robert Erickson, a political scientist, calls this the “presidential penalty.” Edward Tufte and Gary Jacobson call it a “referendum” on the party in power. Statistical models can provide evidence for these dynamics by predicting aggregate swings in popular vote share or seat loss as a function of the president’s approval rating, growth in real disposable income, and the number of seats the party in power controls (more seats means more to lose). After the 2018 midterms, Jacobson wrote:
Updated and applied to 2018, with Trump’s approval in the last Gallup Poll before the election at 40 percent and real income growth at 2.1 percent, this model predicted that Republicans would end up with 41 fewer House seats than they held after the 2016 election, 40 seats fewer than they held on Election Day— improbably, the precise outcome in 2018 (Table 1).
More recent literature shows that the midterm penalty is higher when one party controls the House, Senate, and Presidency at the same time — as Democrats do today. In “Party does not matter: Unified government and midterm elections,” Jacob Holt writes that
unified government increases the number of seats a president's party loses during a midterm election. In addition, unified government reduces the number of seats saved by presidential approval and increases surge and decline effects. [Emphasis added.]
A note on turnout and persuasion
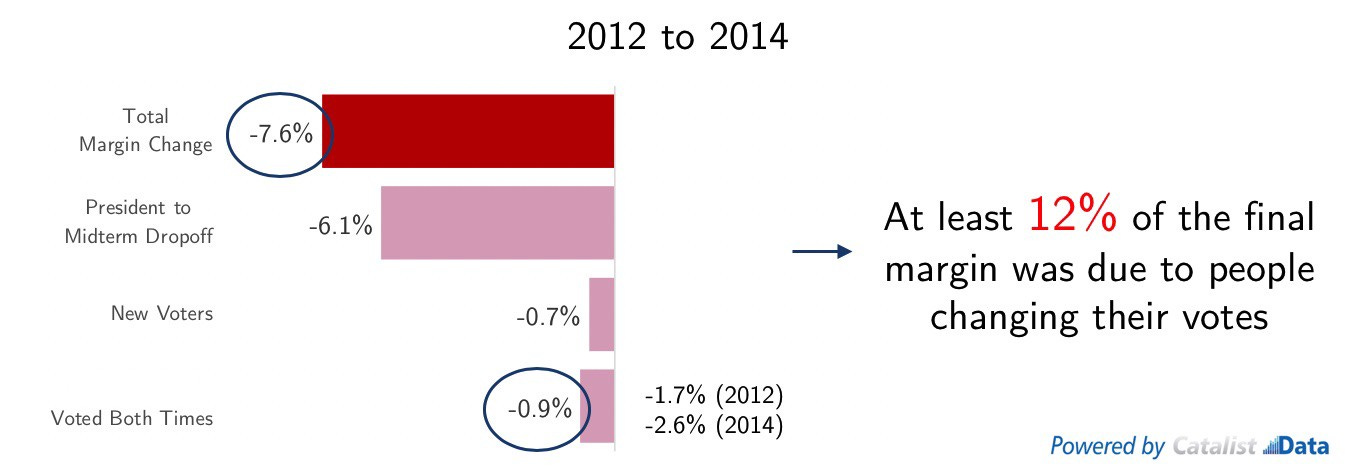
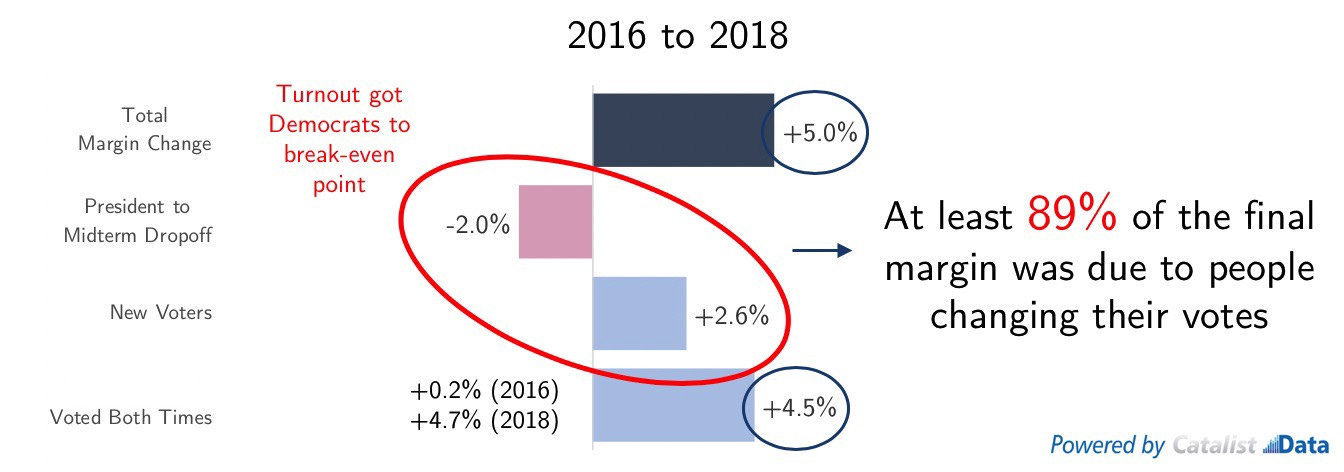
Before I go on, I should note that by focusing on aggregate seat change and vote swings, the old literature on presidential penalties misses a key aspect of voter behavior in midterms. Studies of individual-level data on turnout and vote-choice show that the “presidential penalty” is not only due to people switching away from the president’s party but also because their supporters don’t turn out. Such studies on the 2014 and 2018 midterms by Catalist show that dropoff cost the Democrats 6 percentage points in aggregate popular vote from 2012 to 2014, while vote-switching cost them just 1%. In 2018, vote-switching was worth Democrats 5 points while dropoff cost them 2. Here are their charts:
(Now back to the main article.)
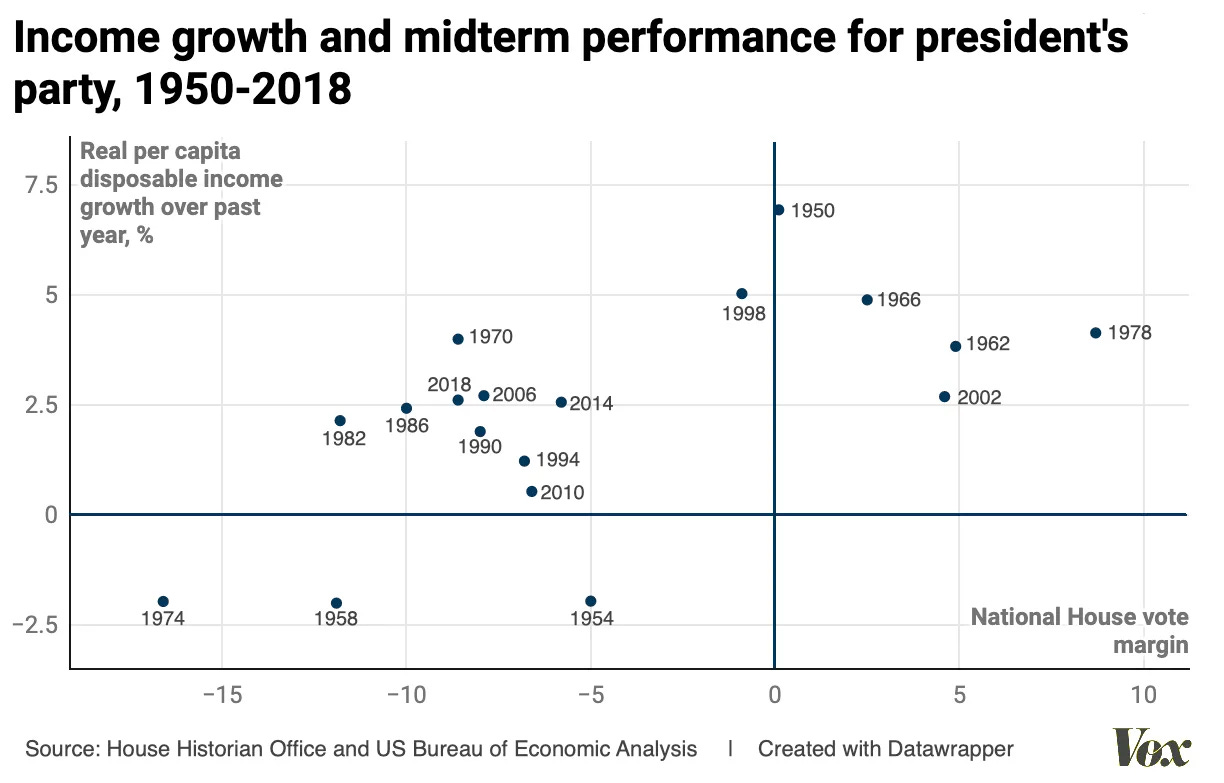
Research also suggests the magnitude of the midterm penalty is a function of the president’s approval rating and growth in real disposable income. I’m borrowing again from Prokop here, because his charts are nice, but note this is a very robust finding of the social science:
Note, however, that presidential popularity does most of the work here.
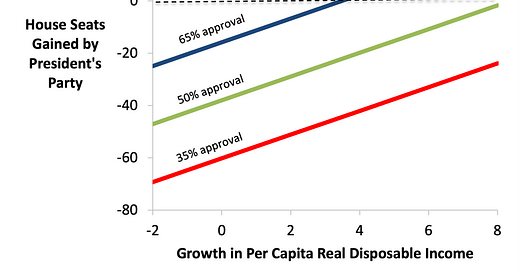
Seth Masket, another political scientist who studies parties and elections, shows the results of a model of House seat losses using both variables in the following chart (which I have borrowed from this blog post). The chart shows different predictions of seat loss for different values of growth in per-capita real disposable personal income (RDPI) and presidential approval. At 50% approval, for example, a president with a -2% change in RDPI would lose about 45 seats in the midterms. At 8% growth and the same approval, Masket’s model would predict a loss of about 5 seats.
Plugging in the latest values for each variable — a -0.3% growth rate in RDPI and an approval rating in the low 40s — we’d predict Democrats would lose roughly 40 seats in the House in November. If Biden can get his approval up to 45% and real income is growing at a range of 2%, his party would instead be expected to lose about 35 seats. The margin of error on those predictions is about 25-30 seats.
Thinking like a statistician
Because this tends to get lost in translation, I want to clarify exactly what I’m arguing here. I am not arguing that nothing matters to outcomes and you should suspend all belief in politics and rational voter behavior. Indeed, the research here indicates that there several factors that predict midterm elections beyond a simple model of who controls the government. We have looked at studies showing unified government, big policy change, low presidential approval, and negative economic growth all make things worse!
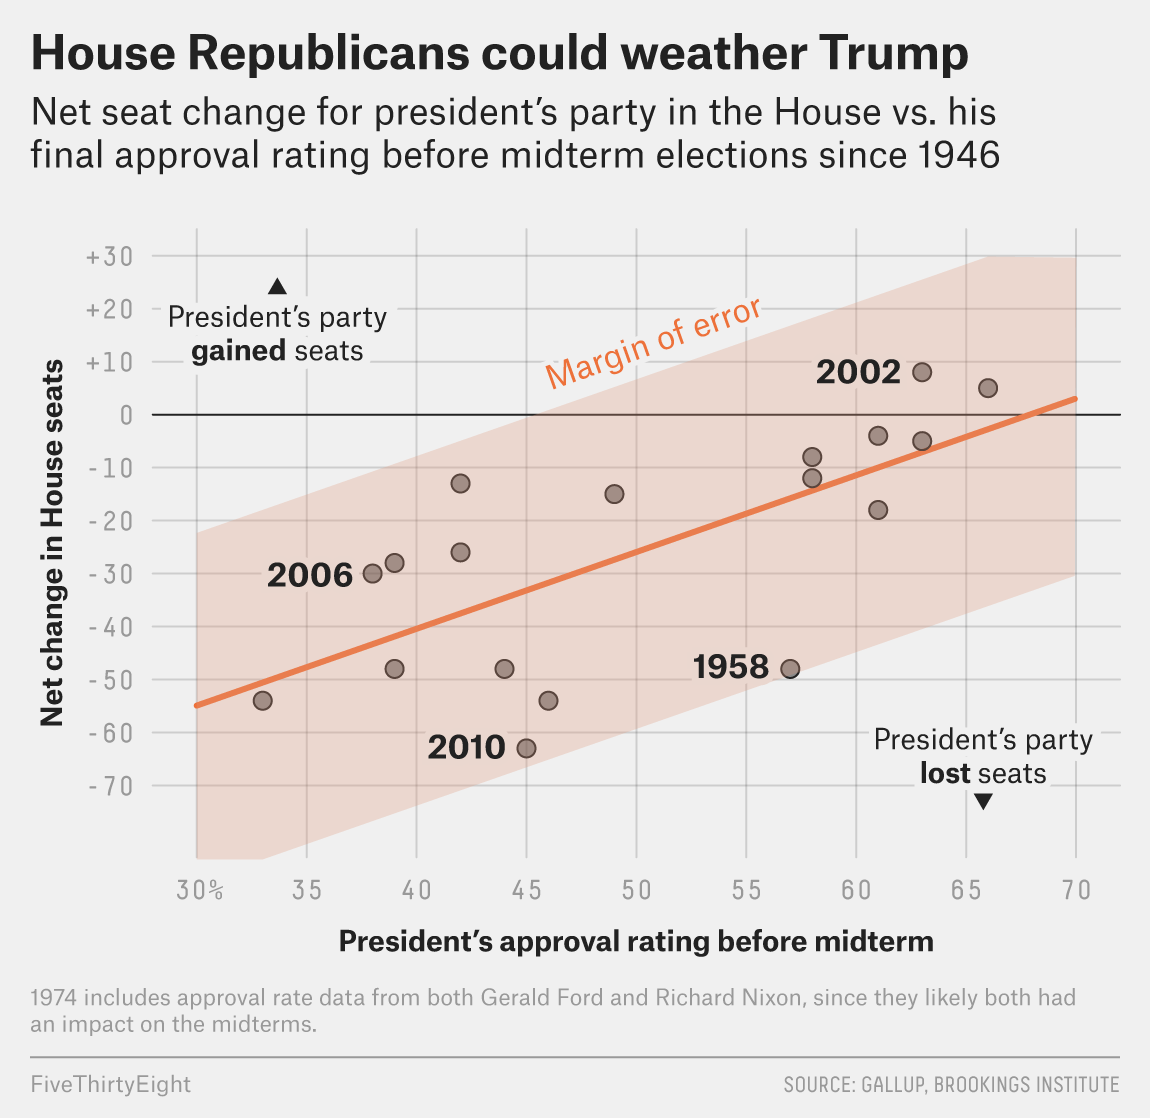
Rather, to borrow some language from statistical modeling: Midterm elections act like simple linear (or multivariate) regressions with a huuuge intercept shift. One easy way to see this is in the following chart of presidential approval and House seat loss:
That model shows that the president’s party loses seats for every realistic value of Biden’s approval. Each one would be large enough to flip the control of the House.
Thus, our default — or the intercept of the model — should be a very bad showing for Democrats in November simply because they are the party in power. Then, based on the precise conditions of the country — or, the slope of the model — you adjust the prediction accordingly, generating marginal changes in expected seat loss.
How midterms work (and why that matters)
Let’s package this all up.
Using the sophisticated prediction models, we get an expected 35-40 seat decline in Democratic House seats in November. And while that is higher than the average 28 seat decline across contests since 1946, the small difference between the models suggests much of the outcome is simply determined by which party holds the presidency.
This matters for politicians and strategists. Elected officials have to decide before the midterms how much policy change they can pursue before suffering higher-than-expected losses at the ballot box. The data covered in this post suggests they should be fairly aggressive, as they are likely going to be thrown out no matter what (especially because they have unified control of government).
But studying the dynamics of midterm elections also matters for a proper narrativization of US politics. Over the next nine months, you are going to read hundreds of hot takes about how Democrats’ infighting, covid-19 restrictions, the woke left, etc have doomed Democrats for the midterms. But the political science evidence suggests you should second-guess basically all of that!
Congressional election outcomes serve as very limited barometers of the public’s preferences for policy and presidents. That is evident by the fact that even a popular Democratic candidate presiding over 4-5% annual economic growth would be favored to lose control of Congress! If Democrats lose 30 or 40 seats in November, it is very hard to claim that x, y, or z is the thing that costs them electorally.
That’s because lots of things matter marginally but most of the swing is already baked in. Though they have some control over how many seats they will lose in November, barring a war or political realignment by November, the Democrats lost Congress when they won the White House.
Brief book update!
STRENGTH IN NUMBERS gathers strength
There are now quite a few favorable blurbs of my upcoming book up on W. W. Norton’s website, and it is crawling its way up Amazon’s rankings — from, like, top #2,500,000 to 300,000. (Wow, so popular!) One reviewer called it “a suspenseful whodunnit, tragedy, and love-story for data.” How poetic. Another just said “‘Read G. Elliott Morris’s superb book, Strength in Numbers.’” You can’t disagree with the succinctness!
The bad news is that the release date is still not until July 12th! That means our marketing push doesn’t begin for a few more months, so I’m not technically supposed to tell you about pre-orders yet. (I mean, I haven’t even shown Twitter the cover yet, so is it even a real book?)
But the blurbs are still pretty great!
Posts for subscribers
If you liked this post, please share it — and consider a paid subscription to read additional posts on voter behavior, public opinion polling, and democracy.
Subscribers received two extra posts over the last week:
That’s it for this week. Thanks very much for reading. If you have any feedback, you can reach me at this address (or just respond directly to this email if you’re reading in your inbox).





Many thanks for the charts!
I omitted 1992 because of the obscuring Perot factor, the most consequential 3rd party candidacy since 1912. In looking for patterns, it helps to go back a bit further than the presidential year, since that election is often itself an outlier -- 1966 for the most part returns to 1962 and earlier, for example, as does 1982