

September 22, 2019 📊 Which Democrats are still actually in the running for 2020?
September 22, 2019 📊 Which Democrats are still actually in the running for 2020?
Plus, why I'd rather be Warren than Biden, and how China mobilized a mass of Twitter bots for political propaganda

Welcome! I’m G. Elliott Morris, data journalist for The Economist and blogger of polls, elections, and political science. Happy Sunday! This is my weekly email where I write about politics using data and share links to what I’ve been reading and writing. Thoughts? Drop me a line (or just respond to this email).
Dear Reader,
This week’s main read: There is better than a 50% chance that the two leading 2020 Democratic candidates, Elizabeth Warren and Joe Biden, will win the party’s nomination for president next year. But according to my analysis of past primary polling, there’s a 46% chance that anyone else could win the nomination. To me, that doesn’t quite meet the definition of a two-person race—yet if you’re going to bet on any one horse you should be picking either Biden or Warren. (Read on and I’ll tell you why I think Warren is the better bet).
This week, the NYT also had a great visualization of Twitter bot networks in China, and an old (debunked!) theory about “shy Trump voters” resurfaced, so it’s worth revisiting the evidence.
Thanks all for reading my weekly email. Please consider sharing online and/or forwarding to a friend. The more readers, the merrier!
If you’d like to read more of my writing, I publish subscribers-only content 1-3x a week on this platform. Click the button below to subscribe for $5/month (or $50 annually). Subscribers can leave comments on posts and join in on private threads, which are fun places for discussion!
My best!
—Elliott
This Week's Big Question
Which Democrats are still actually in the running for 2020?
According to national polls, the chance that Biden or Warren wins the nomination is just above 50%. But the early states might look more like a two-person race.

Image: Charlie Neibergall/AP Photo; Politico
A new poll from CNN, the Des Moines Register and Mediacom finds a tight race in Iowa; 22% of likely Iowa voters support Elizabeth Warren as their first choice for next year’s caucus, whereas 20% support Joe Biden as their first choice. You can add the new poll to the pile of recent data showing Biden and Warren leading the pack of possible nominees, but should we really be writing off all the other candidates? Is the race for the Democratic nomination really a two-way contest as some people are arguing?
Primary polling from previous cycles may help us calibrate our answer. The question we want to answer is: How likely is it that a candidate polling at x% will win the nomination?. Using a dataset of primary polling going back to the 1970s, we can easily answer this question using logistic regression. Below, I’ve graphed the predicted probability that a candidate wins a party’s nomination given their standing in national polls. I’ve also calculated this relationship at different points in the election cycle; the purple and orange lines represent probabilities at today’s point in the cycle (42 weeks away from the nominating conventions) and in June the year before the convention (60 weeks out) while the green line shows how the relationship looks by the time we reach Iowa (20 weeks out).
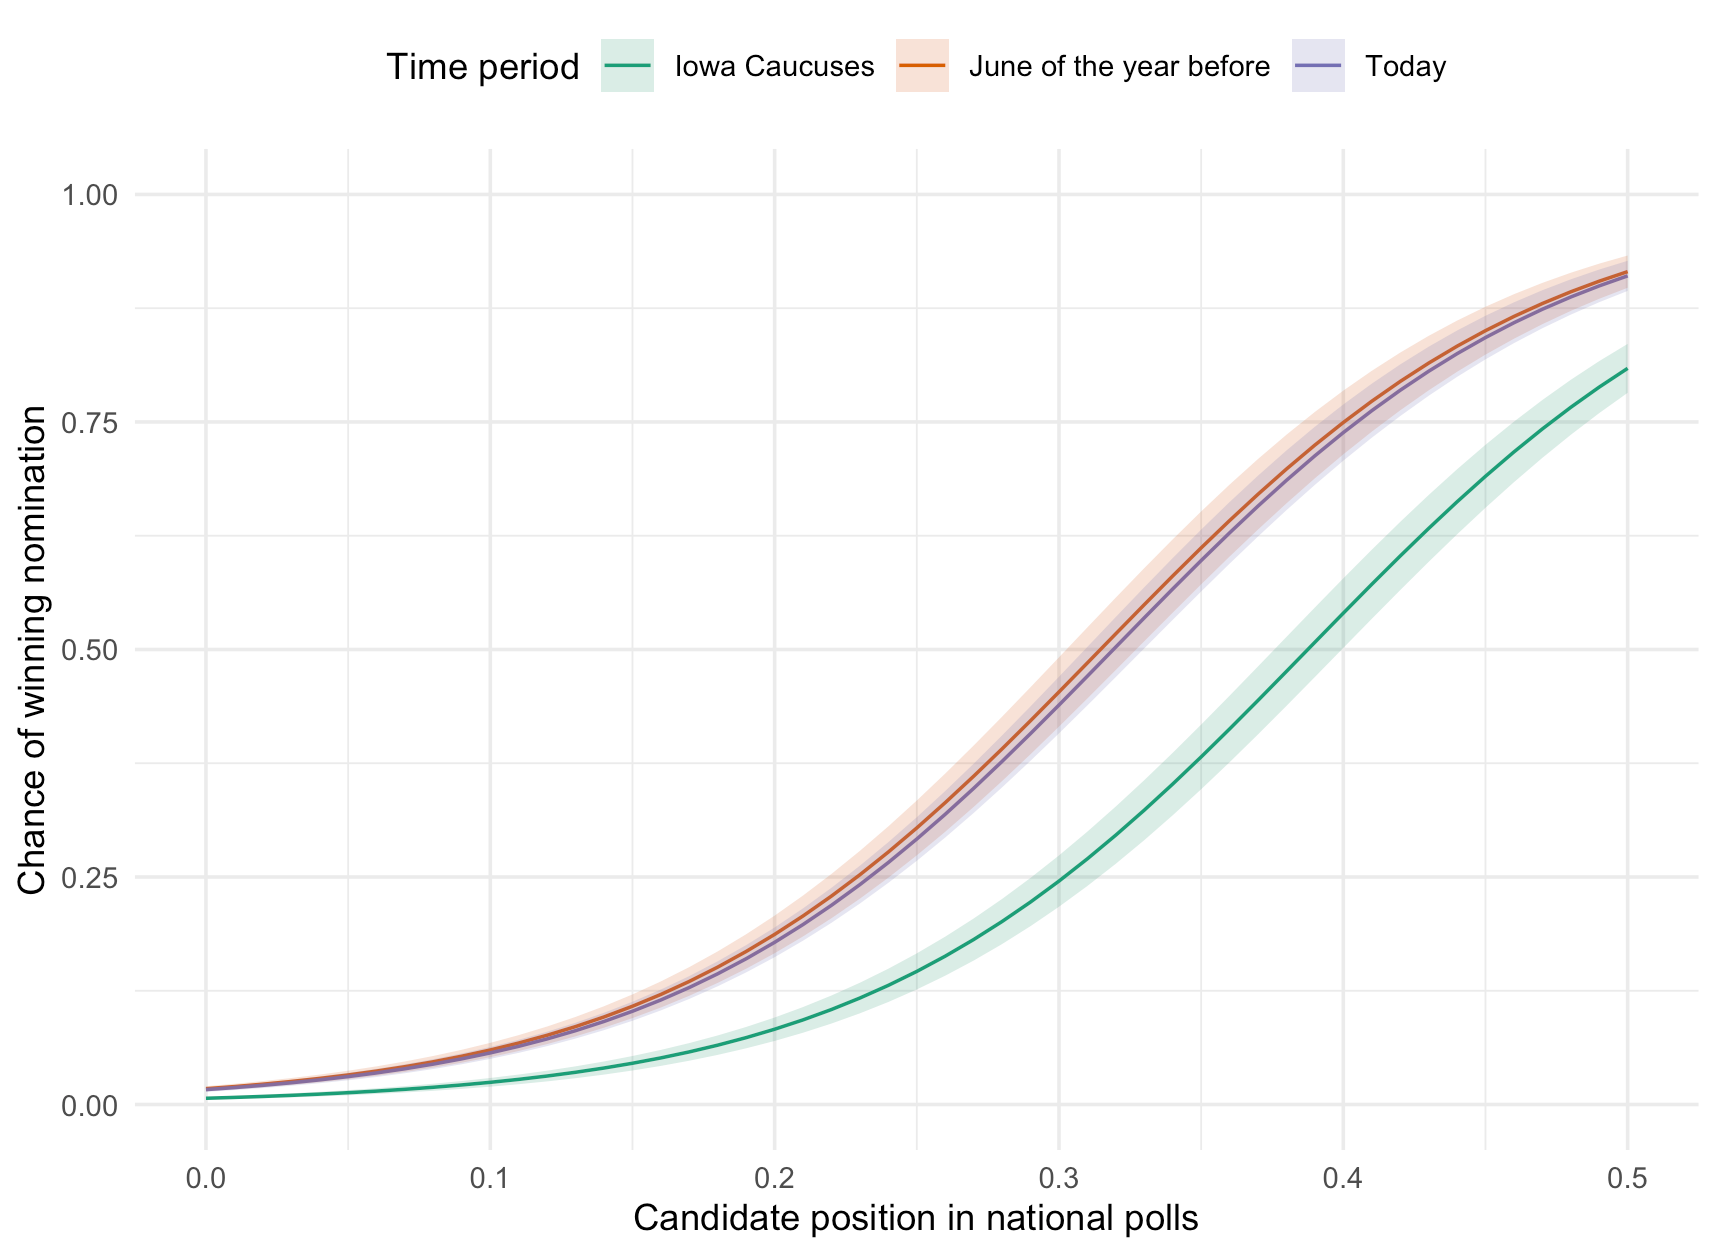
Reading the graph tells you, for example, that a candidate who is polling at 30% nationally has a roughly 45% chance of winning the Democratic or Republican nomination.
So how do the 2020 candidates stack up in this analysis? I’ve added annotations to the next graph to show their probabilities of victory given their current standing in national polls, per The Economist’s aggregate:

Candidates in Biden's position in the polls today (27%) have gone on to win the nomination about 35% of the time. Candidates in Warren's position (19%) win in 1-in-5 primaries. Sanders (16%) comes in at 1-in-7, and odds sink below 1-in-10 for all the other candidates in the primary (Harris and Buttigieg are both polling at 6% today).
As of today, it’s more likely that Biden or Warren is the nominee (54%) than it is that anyone else in the field wins (46% total). I wouldn’t necessarily call that a two-person race, but there’s evidence that the other candidates could have trouble closing the gap. According to the latest The Economist/YouGov polling, Bernie Sanders, for example, ranks low on the list of candidates that other hopefuls’ first-choice voters are also considering.
Plus, according to a recent poll from Data for Progress and Civiqs, only 12% of voters nationally say the Vermont Senator is their second choice for the nomination.
Why I’d rather be Warren than Biden
While looking at the national snapshot of polls indicates that you might rather be Biden than Warren, such a conclusion would overlook a big factor: Candidates who stall in the polls gradually see their odds decrease over time. Let’s revisit the graph of polling and odds again:
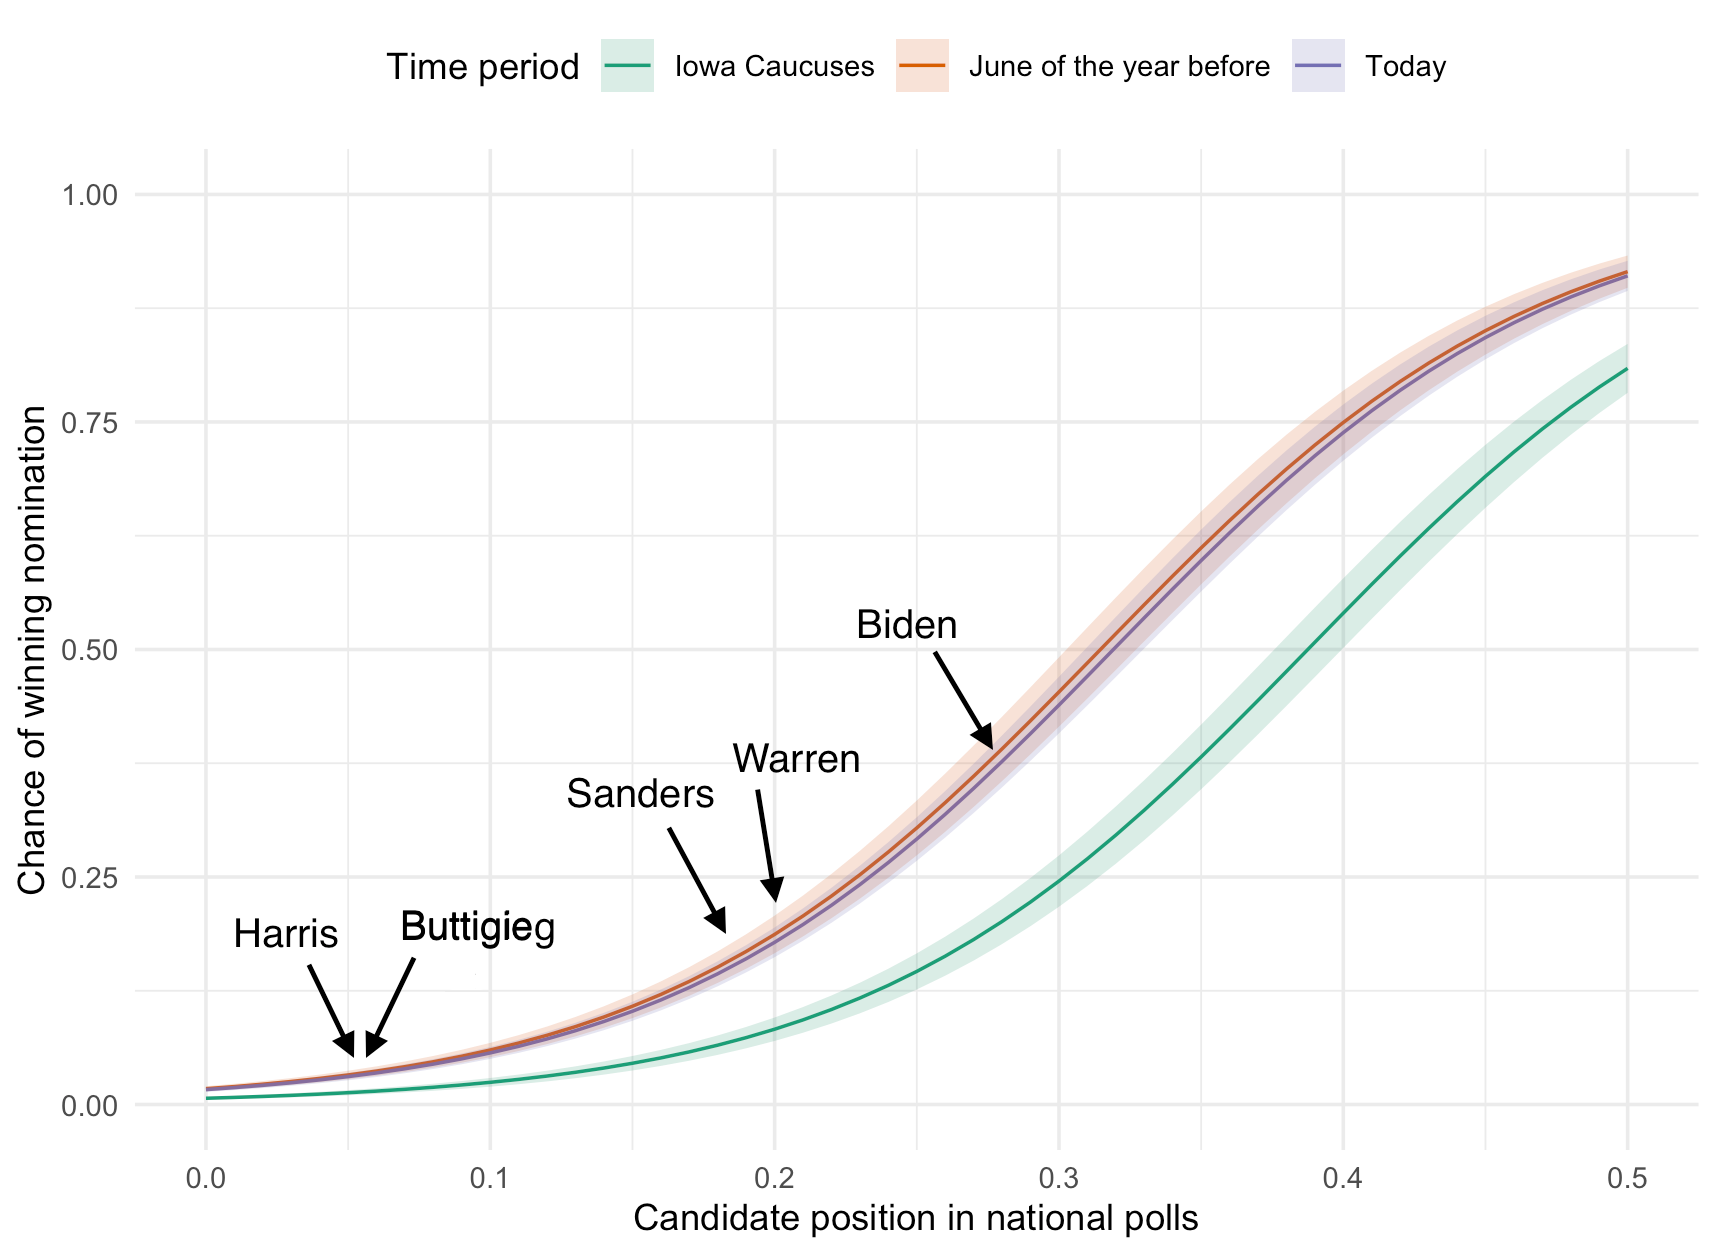
As the green line shows, a candidate in Biden’s position around the time the Iowa caucuses take place wins only 20% of the time. That’s down from a 35% chance today. This means that someone who is holding steady in the polls is actually falling behind. To have better than 1-in-3 odds of winning the primary after Iowa, a candidate needs to be polling above roughly 31% in national polls, versus 24% today.
This is good news for Elizabeth Warren, the only candidate who has gained ground nationally over the past six months, and frankly bad news for everyone else, whose numbers are either flat or fading.
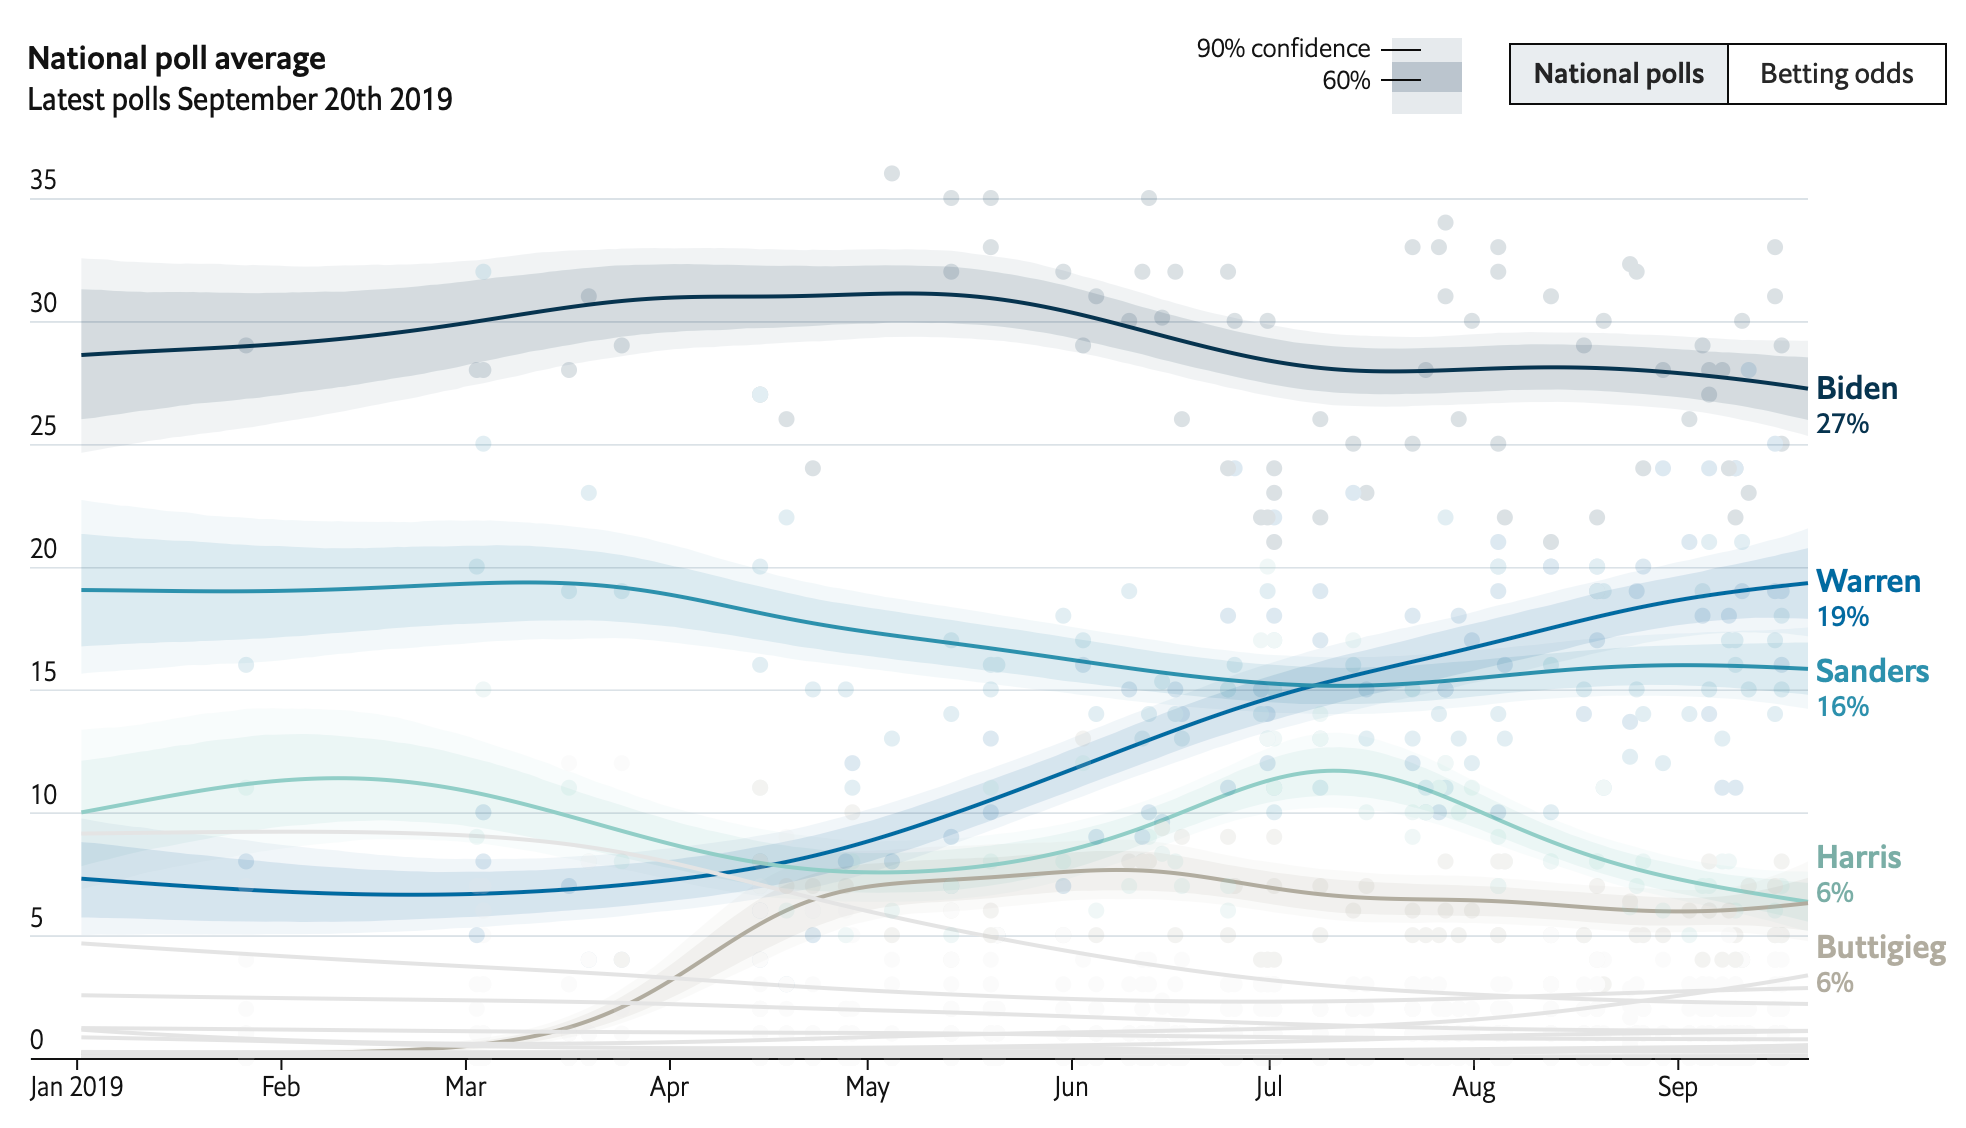
Looking forward, Warren also has the best upside for consolidating support in the early states, which can have a big impact downstream primaries. In Iowa, according to that new CNN/DMR poll, 42% name her as their first or second choice. 12 points more than any other candidate (Biden is at 30).

So, in sum, the chance that someone other than Biden or Warren becomes their Democratic Party’s nominee for the 2020 presidential election is still pretty high, but I’d be hard-pressed to pick any other individual candidate who could dethrone then. Warren looks favored to win the nomination beyond what her topline polling numbers suggest.
And now, some of the stuff that I read (and wrote) over the last week.
Posts for subscribers:
September 20: Voter turnout will be high in 2020. We don't really know what that means yet. It matters which groups are more likely to vote relative to 2016. Not all increases will be uniform
Political Data
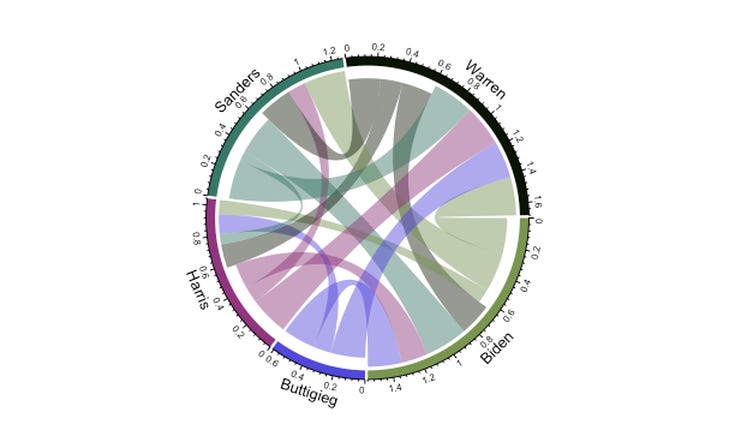
Jennifer Victor and Gregory Koger (Mischiefs of Faction): “Second choice data from Democratic voters shows Warren with an advantage”
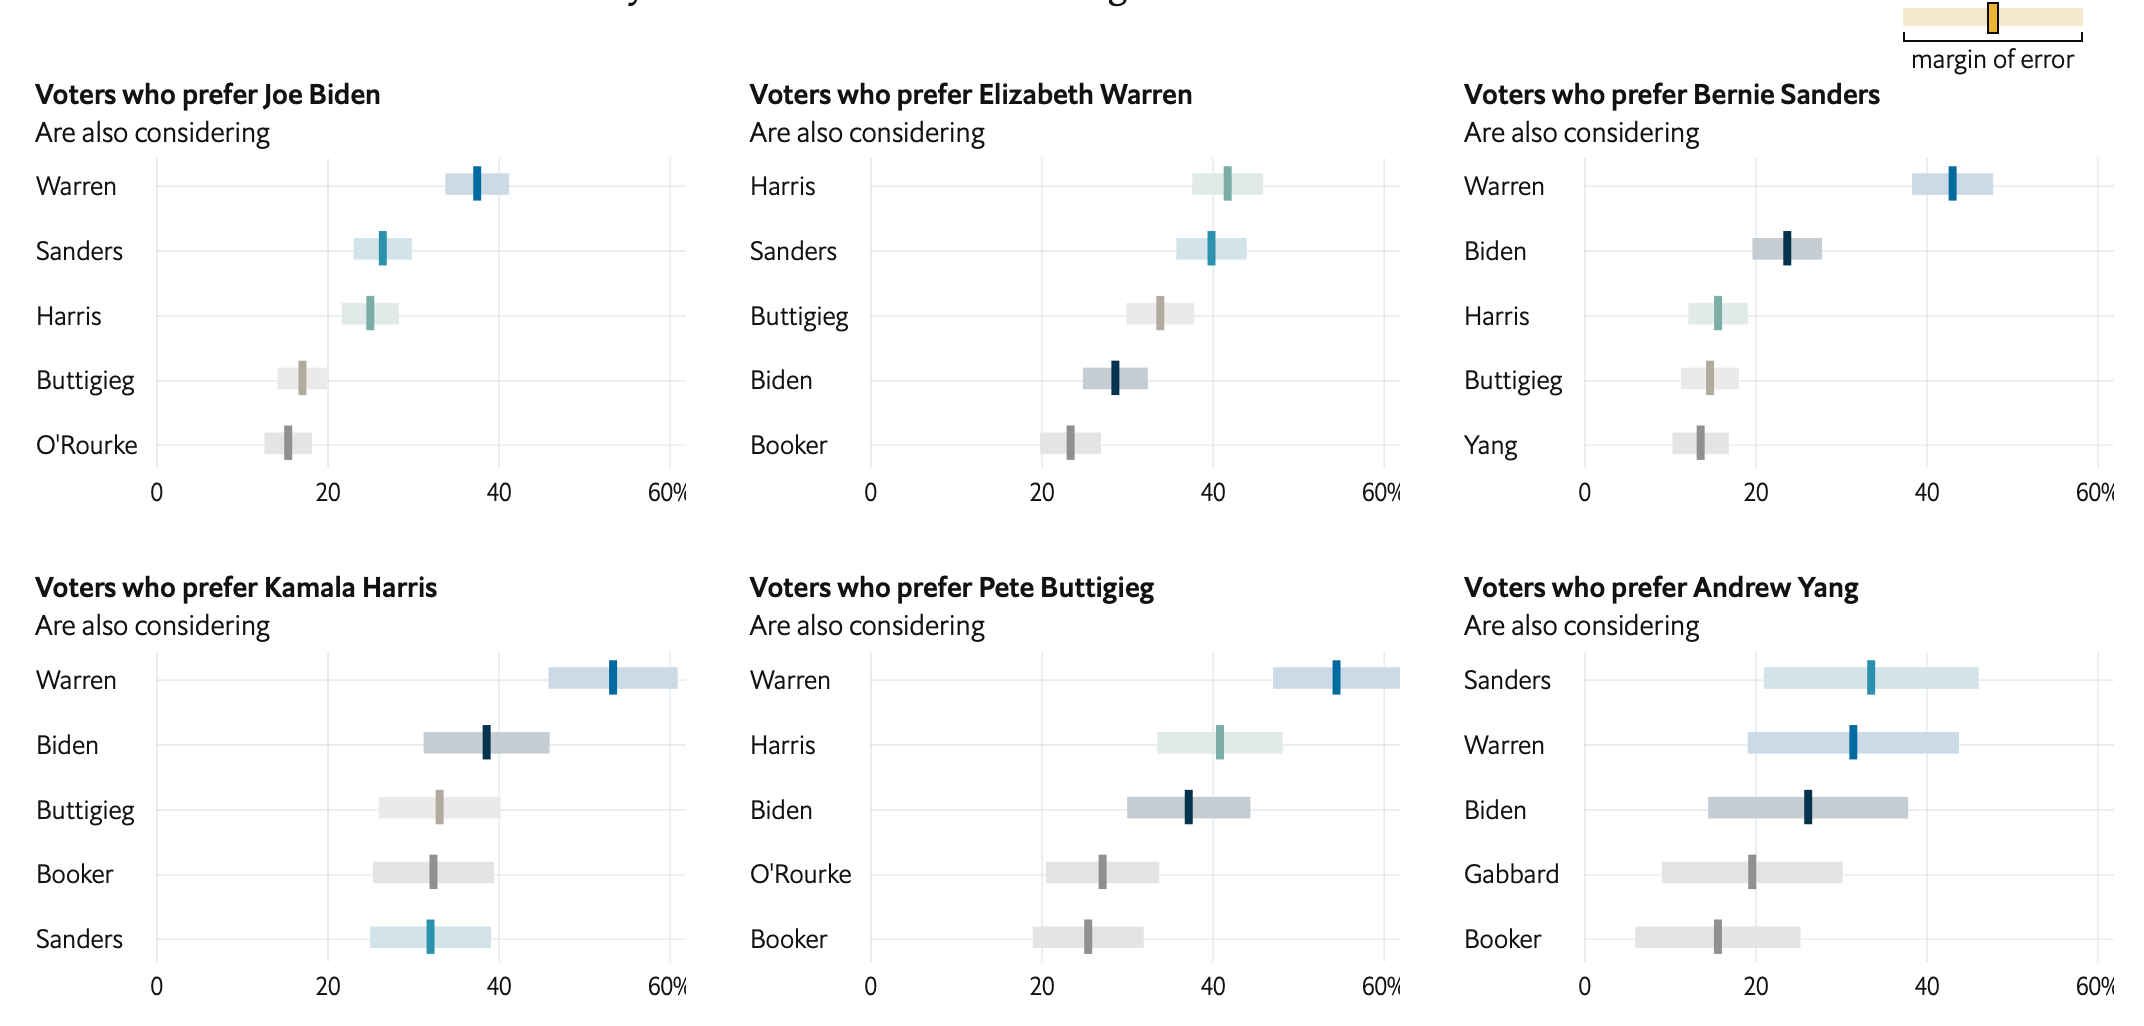
Using the data provided by Morning Consult, we took a look at the second choice candidate preferences for the polling sample. We represent a visualization of those choices in the following graph, known as a chord diagram, because it can help us see movement from one candidate to the next. Looking at these rankings can help us to see how the field might change as candidates drop out of the race.
The graph is a bit complicated, but once you know what to look for, it’s quite revealing. To see how to read it, take a look at Harris as an example. Voters who support Harris as their first choice are shown in maroon. The maroon stripes that go to Warren, Biden, and Sanders, in decreasing order of thickness, show that Harris’s supporters prefer those candidates as their second choice. This means, if Harris were to drop out, most of her supporters would go to Warren, some to Biden, and a few to Sanders.
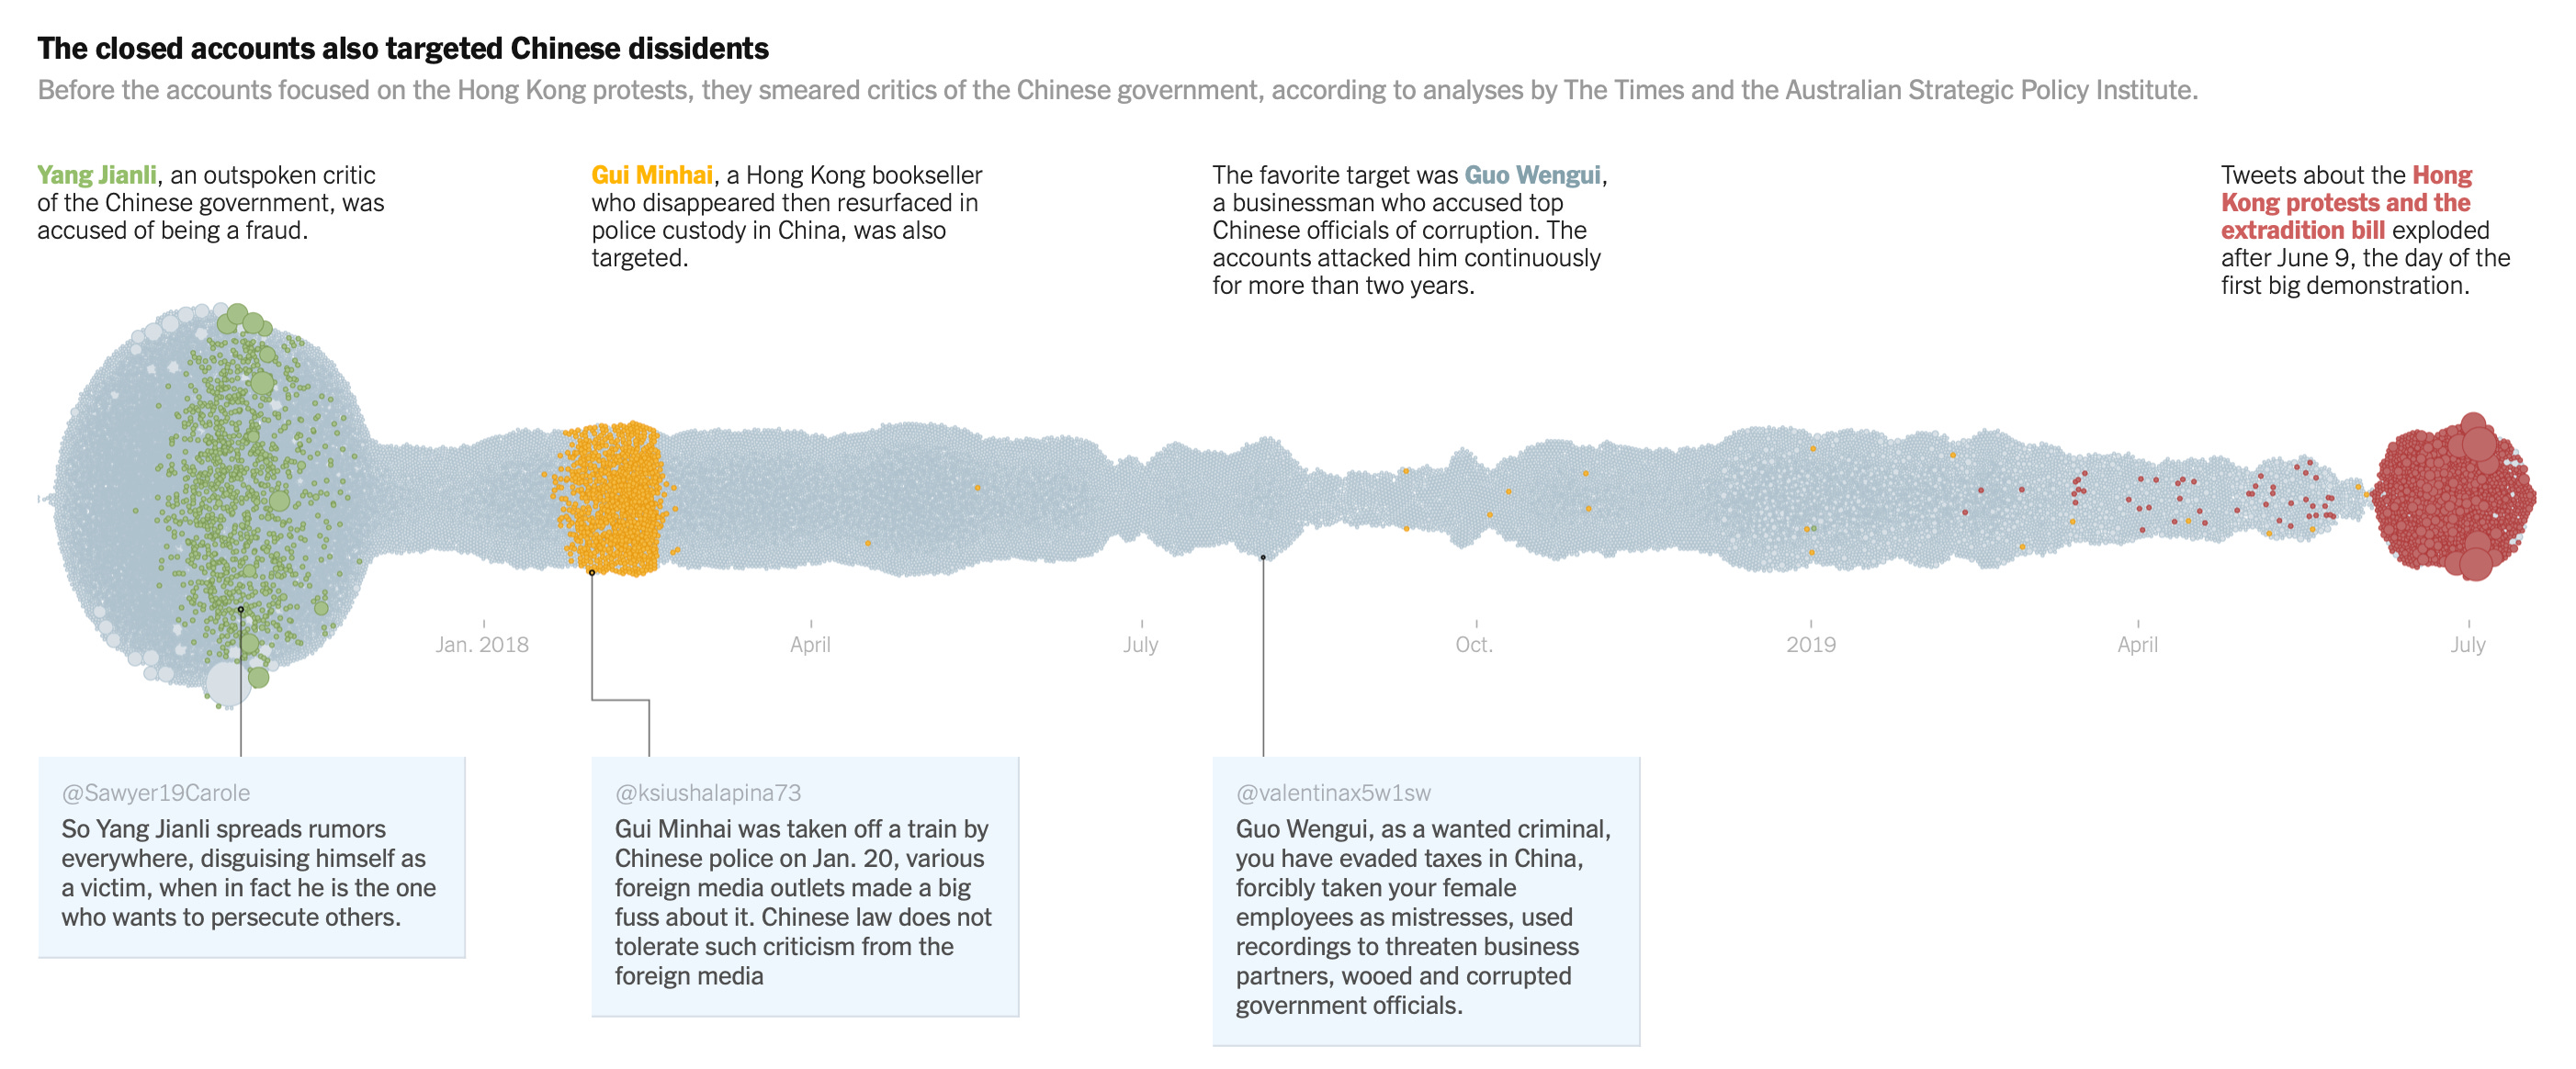
Raymond Zhong, Steven Lee Myers and Jin Wu (New York Times): “How China Unleashed Twitter Trolls to Discredit Hong Kong’s Protesters”
Twitter last month took down nearly 1,000 accounts that it said were part of a state-directed effort to undermine the antigovernment protests in Hong Kong. It also suspended 200,000 other accounts that it said were connected to the Chinese operation but not yet very active. Facebook and YouTube quickly followed suit. All three platforms are blocked in mainland China but not in Hong Kong.
The 3.6 million tweets that the accounts sent represented a campaign that was less sophisticated and more hastily assembled than the one Russia carried out during the 2016 United States presidential election, researchers at the Australian Strategic Policy Institute said in a report published this month.
Instead of taking the time to cultivate plausible yet fake online personalities, the campaign’s operators appear to have simply bought accounts in the shadowy global marketplace for social media influence, where followers and retweets can be had for cheap.
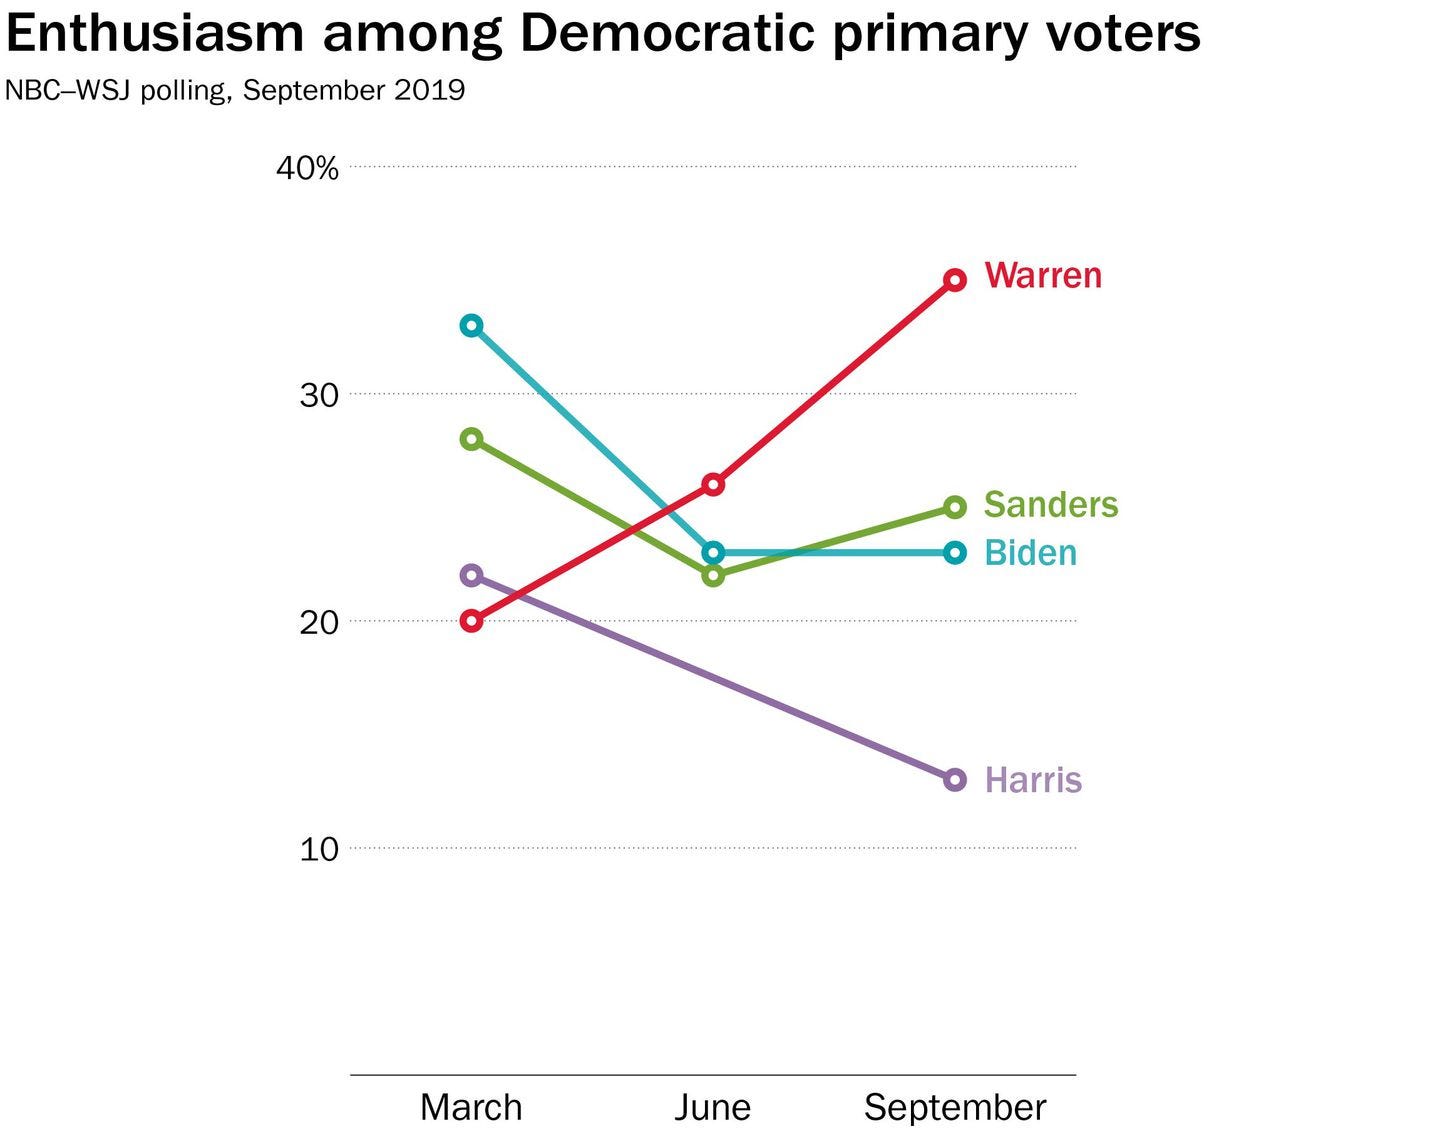
Philip Bump (Washington Post): “It’s early. Things are in flux. But you’d still rather be Warren than Sanders right now.”
Looking a bit deeper, though, something else becomes obvious: Warren is in a much better position than it might seem at first glance.
For example, she is now the top choice when poll respondents’ second choices are taken into account. In July, she trailed Biden both overall and when first and second choices were combined. Now she’s the first or second pick of 45 percent of respondents.
The implication of that is significant. The number of people who have Warren as their second pick is growing — so if other candidates stumble, drop out or (later on) lose, Warren will gain more support than other candidates. About a fifth of respondents have Warren as their second choice, while 16 percent say that of Sanders.
It isn’t just that her support is made up of people settling for her, either. Enthusiasm for her candidacy among Democrats has increased steadily in NBC-WSJ polling, while enthusiasm for both Biden and Sanders has stayed fairly flat since July.
Other Data and Cool Stuff
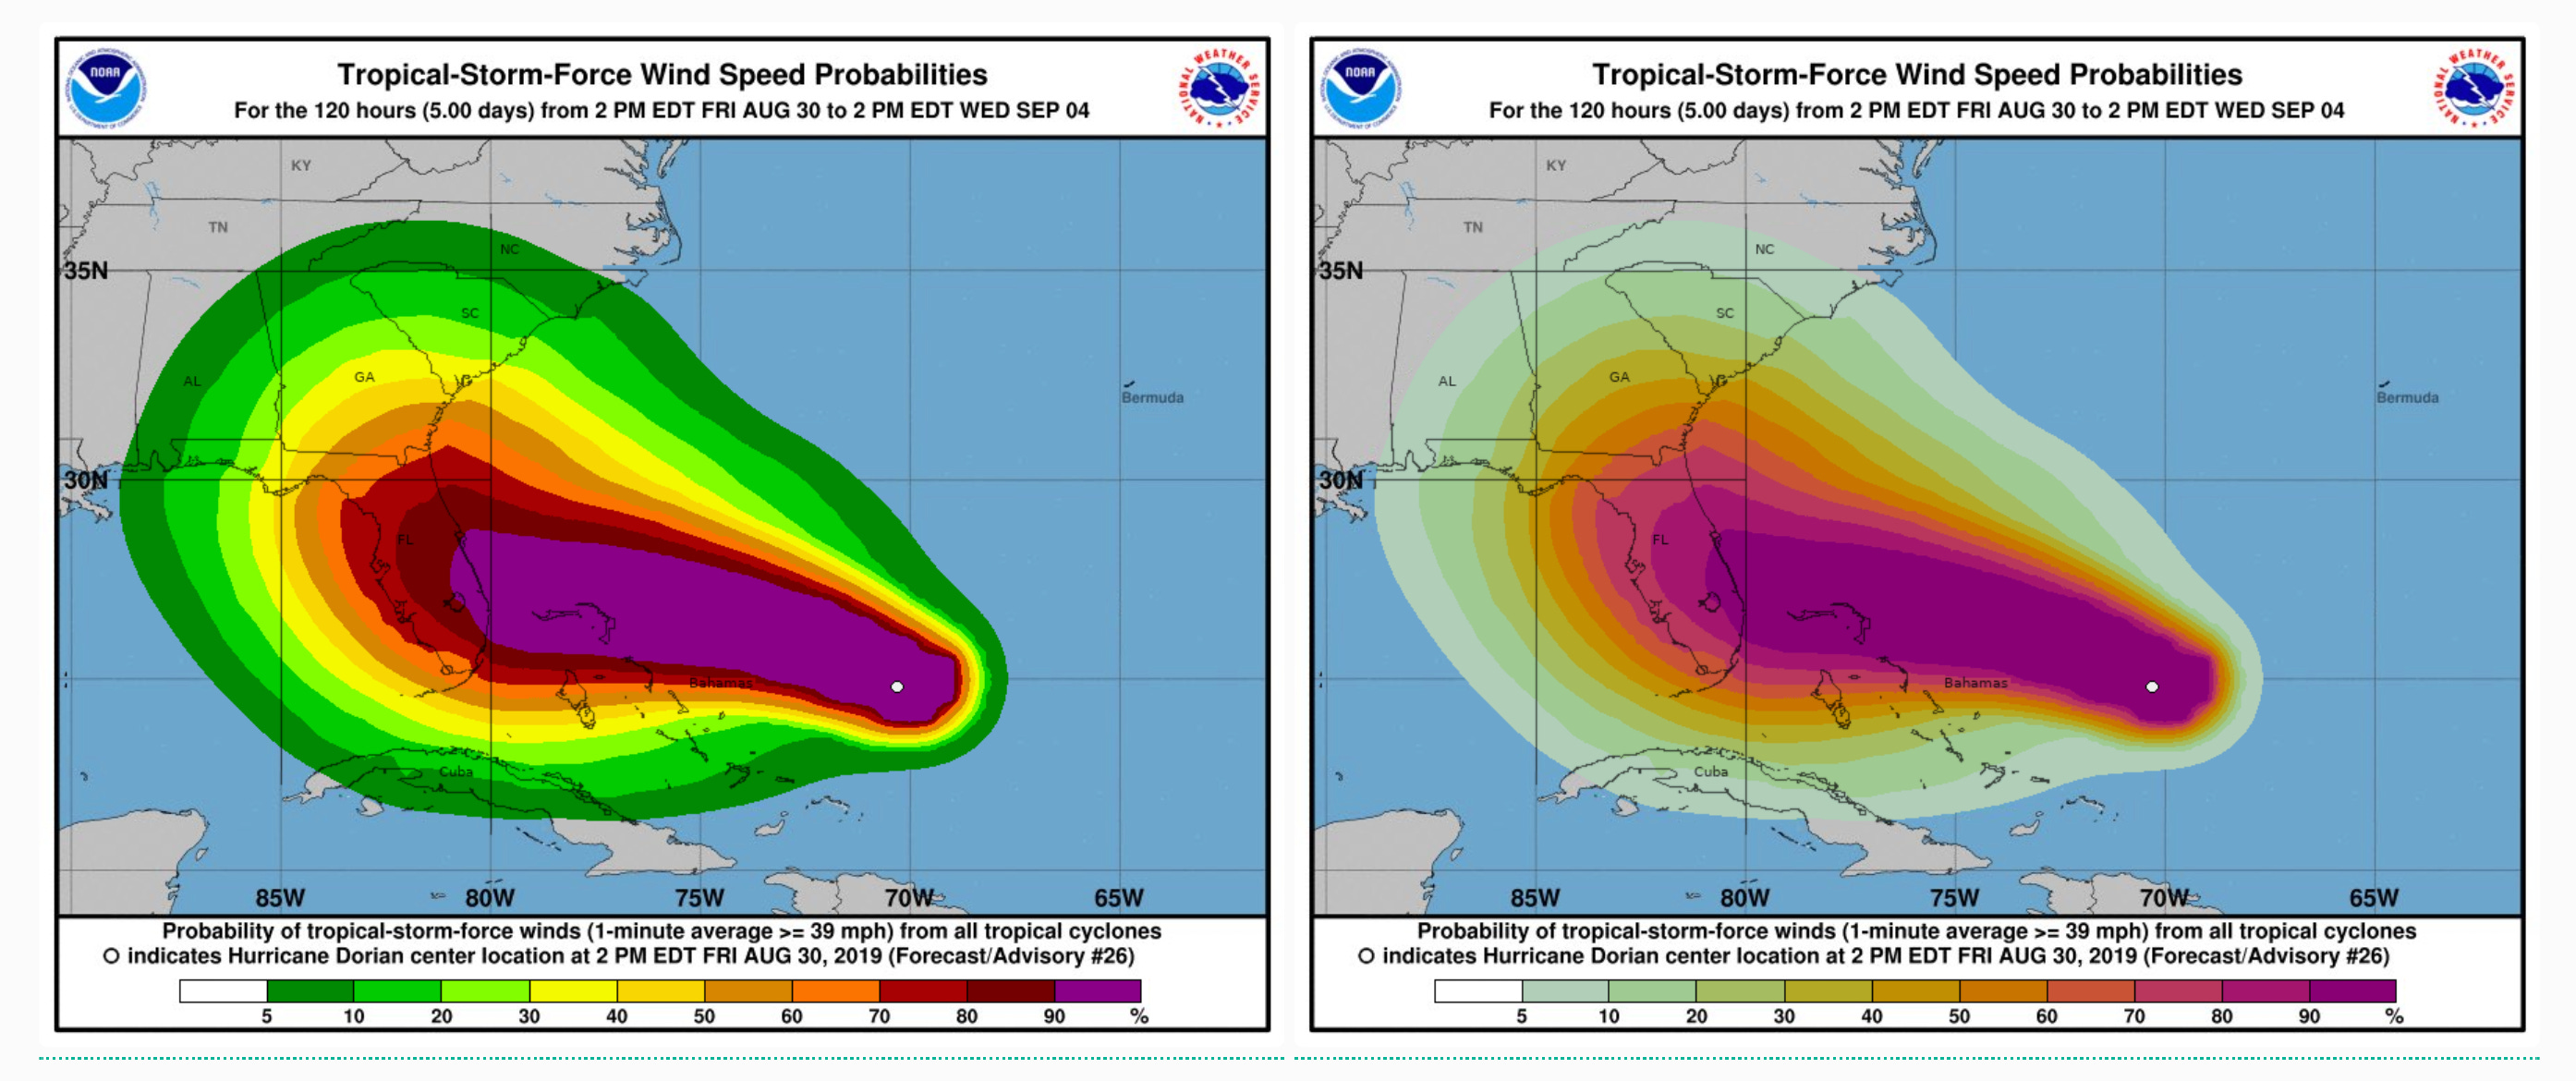
Achim Zeileis: “Was Trump confused by rainbow color map?”
Although the information in the maps can be correctly decoded using their titles and legends, it can be argued that this may require some expertise or experience and that there is some potential for misinterpretations. For example, data visualization expert Alberto Cairo writes on Twitter: “I just want to give him the benefit of the doubt, honestly. These maps are difficult to understand. For me the bad thing isn’t misinterpreting. It’s not apologizing […]”
And one aspect that makes the maps prone to misinterpretations is the color choice for coding the probabilities. This is a so-called “rainbow color map” going from dark green over bright yellow to red and dark purple. Such color maps are still widely used although it has been widely recognized that they have a number of disadvantages. In the following, Reto Stauffer and I illustrate in detail what the specific problems of the top right map are and suggest a better alternative color choice.
Political Science, Survey Research, and Other Nerdy Things
There’s no such thing as “Shy Trump” voters. See this evidence from Alexander Coppock: “Did Shy Trump Supporters Bias the 2016 Polls? Evidence from a Nationally-representative List Experiment”
Adam Bonica on Twitter: “this graph shows the ideological trends of individual donors by professions since 1980.”

What I'm Reading and Working On
I’m reading Stanley Greenberg’s new book “RIP GOP: How the New America Is Dooming the Republicans”. I’ll have a review out on it soon. I’m pretty skeptical of the claim that demographic trends are dooming the GOP.
Something Fun
This hamster eating popcorn:


Thanks for reading!
Thanks for reading. I’ll be back in your inbox next Sunday. In the meantime, follow me online or reach out via email. I’d love to hear from you!
If you want more content, I publish subscribers-only posts on Substack 1-3 times each week. Sign up today for $5/month (or $50/year) by clicking on the following button. Even if you don't want the extra posts, the funds go toward supporting the time spent writing this free, weekly letter. Your support makes this all possible!