Reasonable bounds on presidential election outcomes
How can we know how wide the tails should be?
FiveThirtyEight launched their 2020 election model this week. It’s much less certain than the alternative available, such as that from The Economist or a lesser-known forecaster named Jack Kersting. 538 gives Biden a 72% chance of winning, and the others are in the mid-to-high 80s.
Nate Silver has offered up a ton of justification for why his model is this uncertain about the election. I don’t want to get into who is right or wrong right now—it’s very hard for me to do that objectively since I have a pretty strong incentive to disagree with Nate—but I do want to talk briefly about how we can calibrate our expectations for possible electoral outcomes based on other sources of data, and then gauge which forecasts are more likely because of that.
To introduce the topic playfully: One of the things that I think is funny about the 538 forecast is that they have this little cartoon character that treats you like an idiot in order to explain the model to you. His name is Fivey Fox. I do kind of wish The Economist had a similar tool to offer help to readers but designing these things is hard and they probably don’t want to talk down to people. Here is Fivey:

Fivey reminds me of another orange cartoon character—one who has tails that are similar to the FiveThirtyEight forecast (AKA funky). Here is Tigger and his curly, springy tail:


Okay, maybe that’s a bit too silly. But you get the idea. It’s the tails, people! The tails!
Reading Nate’s (Fivey’s?) charts, I have some reservations about the predictions he’s making. Take the following three time-series, for Florida, North Carolina and Pennsylvania:


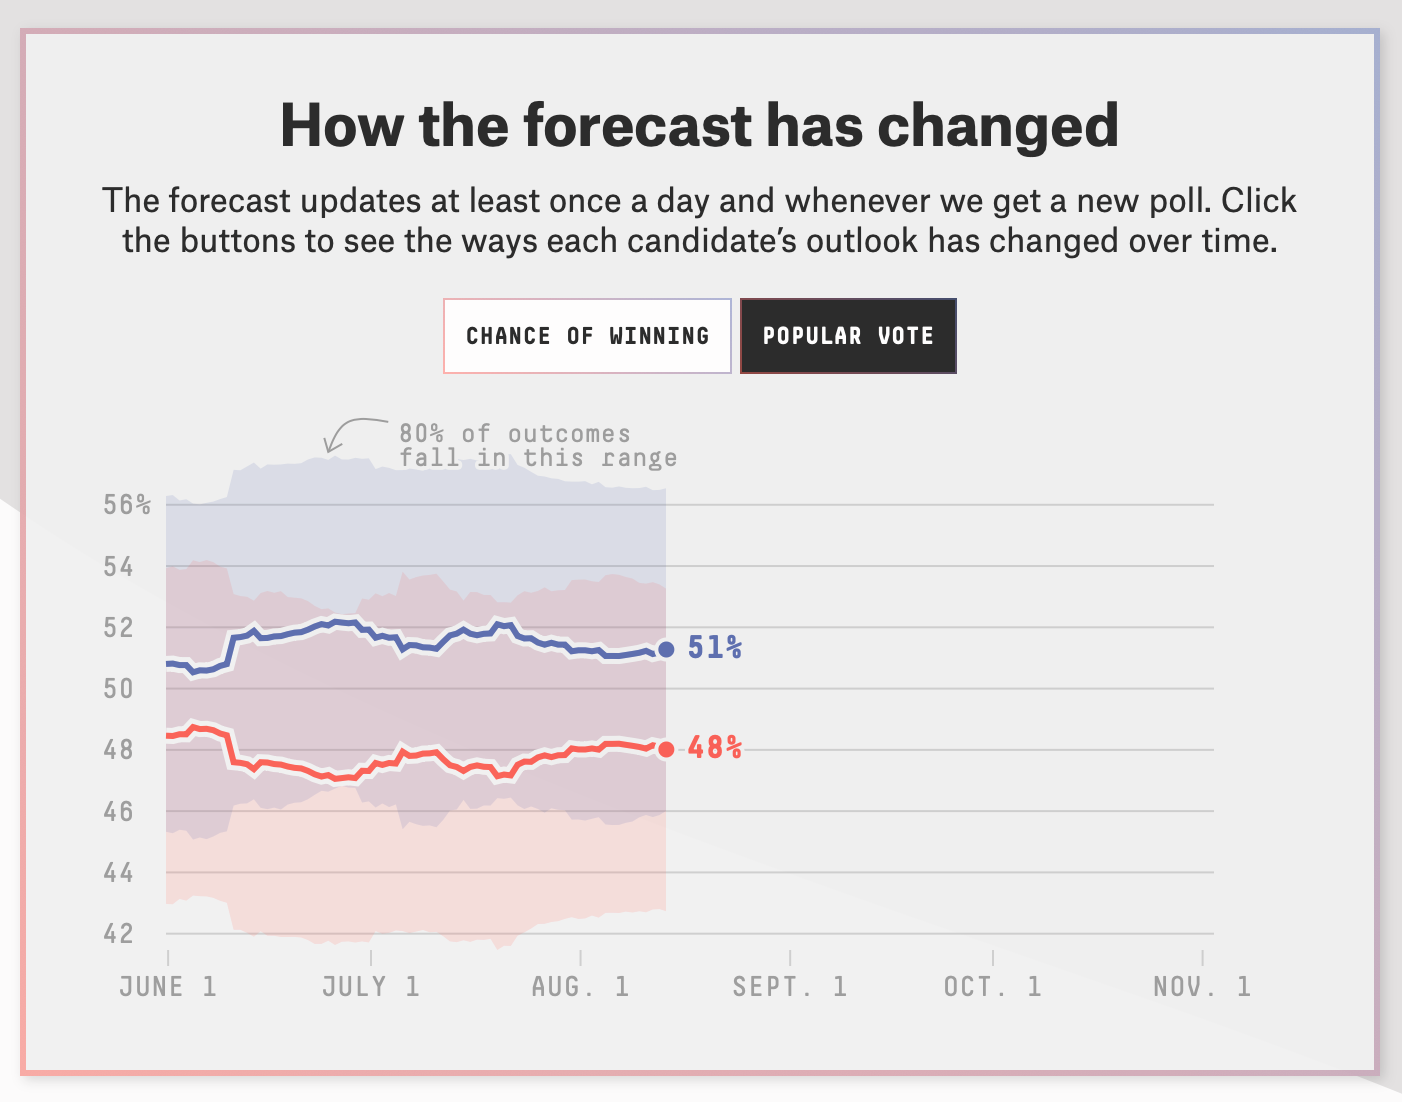
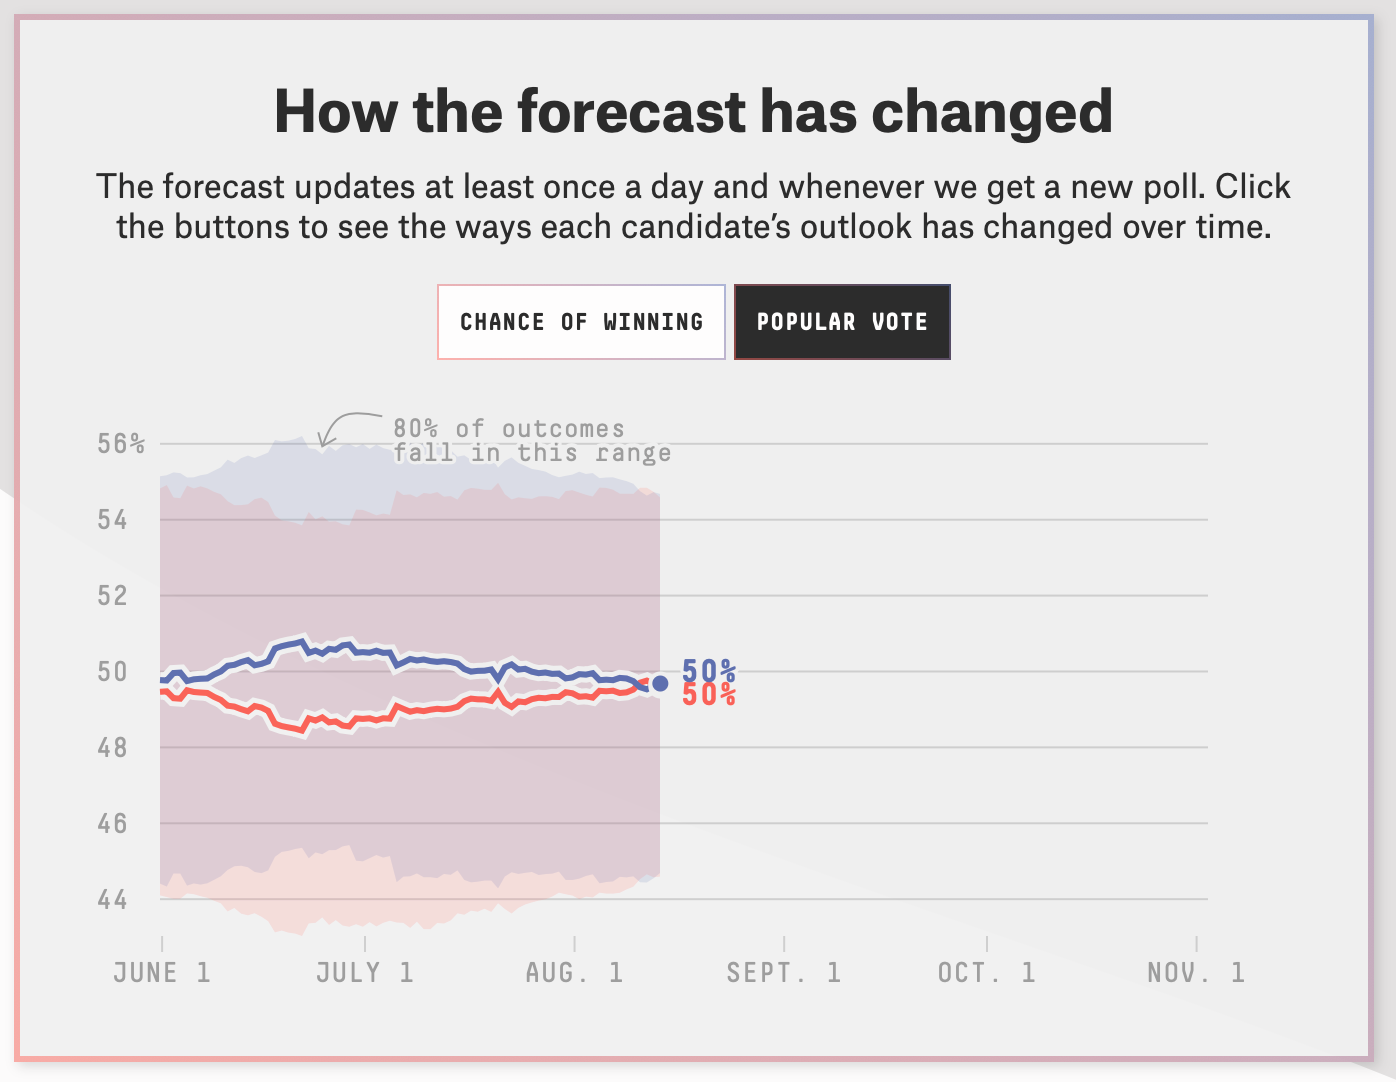
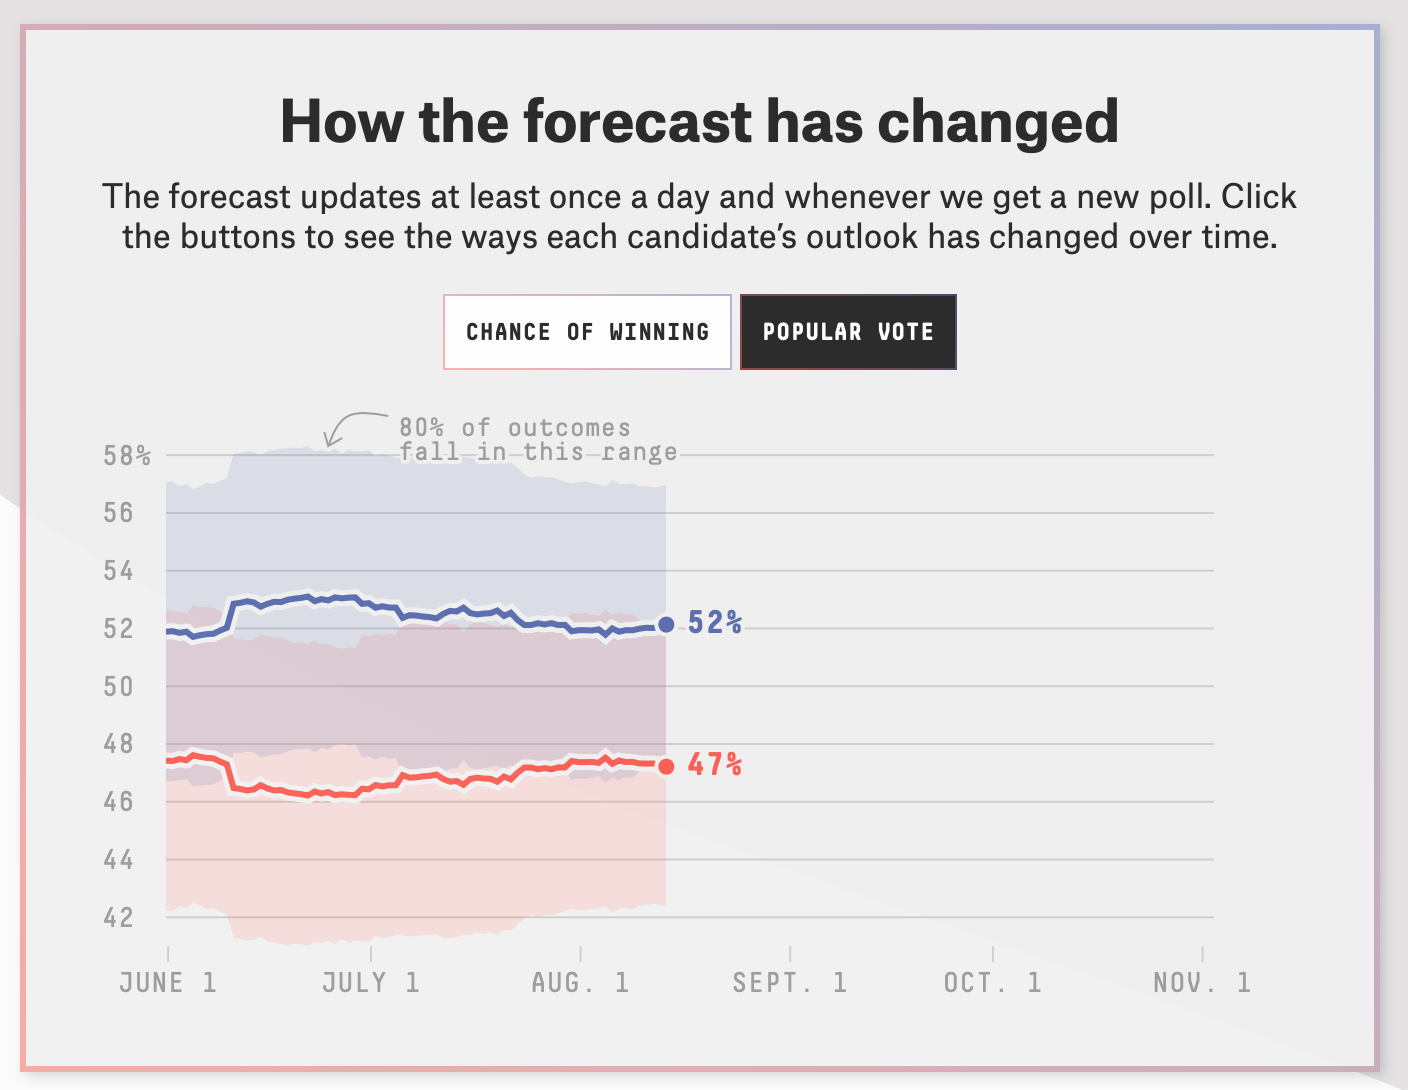
These charts show that Nate thinks there’s a 10% chance of Joe Biden winning by 14 percentage points in Florida, 10 in North Carolina and 15 in Pennsylvania.
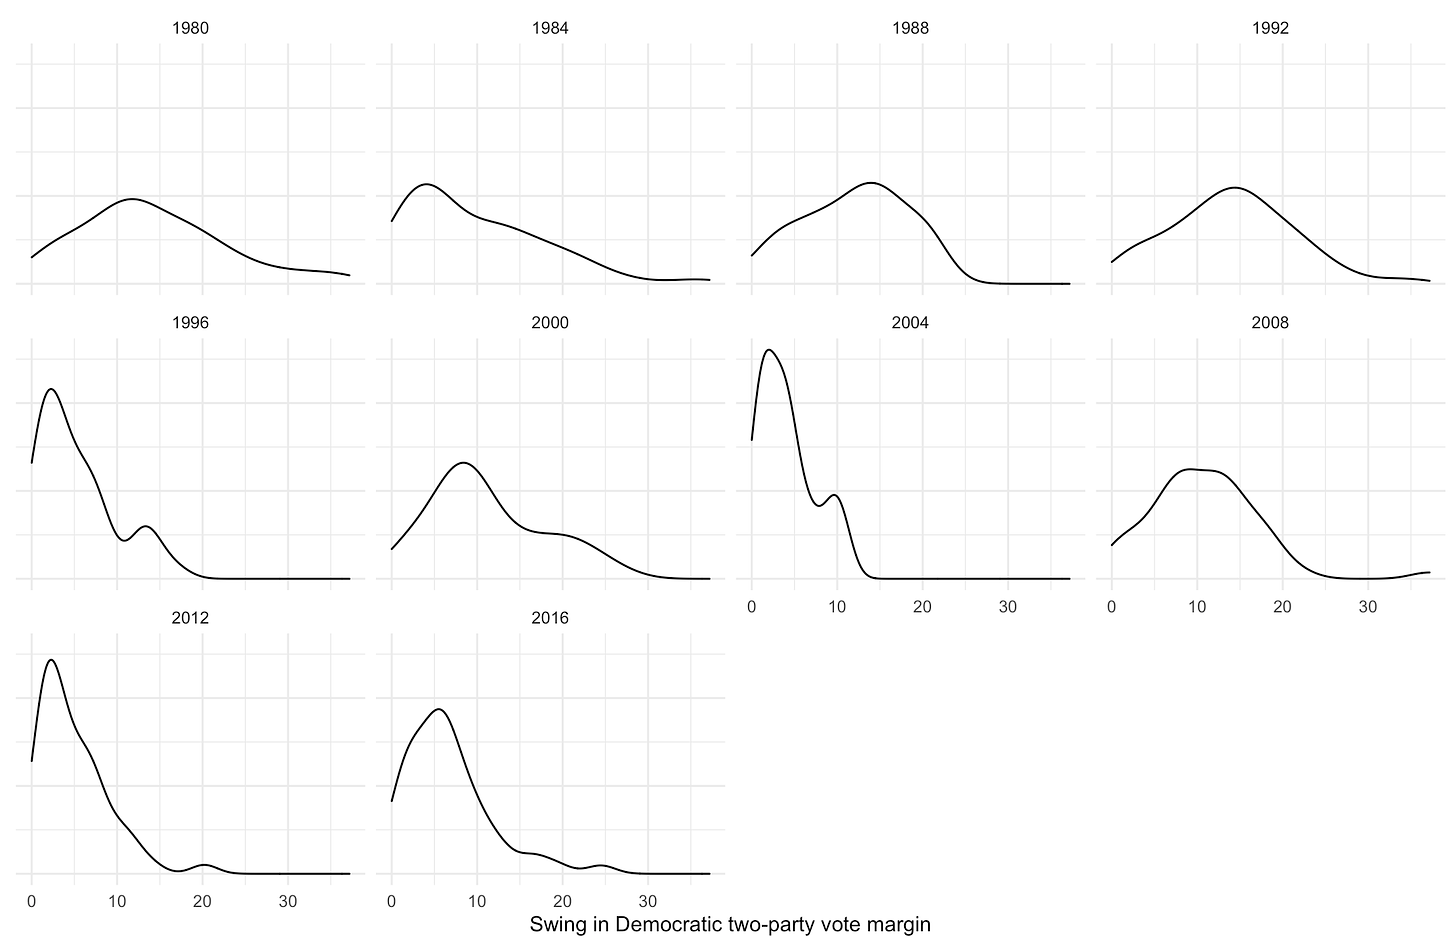
Those outcomes sound implausible to me! Not just because I think that political polarization constrains the electorate to roughly a 10-point national margin for either Democratic or Republican candidates (just beyond how well Obama did in 2008, or the Democrats’ national margin in the House in 2018) but because those margins would represent swings of roughly 15 percentage points on the margin for the Democratic candidate—about 3 points outside the upper bound of the 90% confidence interval for year-on-year shifts in those states over the past 6 elections.

And that’s apriori! Polls at this point in the past cycles have predicted final outcomes with a margin of error close to 12 percentage points on the Democratic vote margin. In the most polarized elections over the past couple cycles, those numbers are closer to 8 points. Additionally, if PA, FL and MI are shifting by 15 points each it’s probably likely that other states are too. And that would clearly push the aggregate year-on-year change beyond the standard deviation of the distributions above. Yet Nate also appears to give that a 10% chance. Note that The Economist assigns probabilities of deviations that large that are closer to 4-5%. And honestly, I really think we should be expecting less error than that, too.
That is, unless this year is super volatile. Which it mind end up being. The economic collapse and coronavirus introduce a lot of new factors for predicting the political environment.
Or so we would think. Perhaps reality is a bit easier to guess, though. Donald Trump’s approval rating has been remarkably stable over the past 3 years. Joe Biden’s margin in presidential trial-heat polls has been less variable than almost every cycle before this one. So maybe we’re getting too caught up in the world around us and not considering the reality of electoral outucomes (especially in the polarized era).


