


If Biden beats the polls in Alaska, what should we predict in New Jersey?
Thinking about a weird problem in 538’s election model

Building predictive models for elections is tough stuff. There are so many different factors to take into account, and making an adjustment for one of them can cause weird downstream effects in how you adjust for another.
That’s why it’s not a huge surprise, and not an especially poor reflection on 538, to find a pretty big error in their election model. Yesterday, my colleague Andrew Gelman wrote up an analysis of the simulations they releases for their presidential election model.
Editor’s Note: This is a paid post for premium subscribers. If you are a subscriber and have friends or family that you think might learn something from this post, you should feel open to forward it to them regardless of their membership. And if you’re a free reader who got this from a friend, consider signing up for posts by clicking the button below!
Andrew downloaded their simulations and looked at the conditional probabilities of the model. For example:
What happens if Trump wins New Jersey?
> condition <- trump_wins[,"NJ"] > round(apply(trump_wins[condition,], 2, mean), 2) AK AL AR AZ CA CO CT DC DE FL GA HI IA ID IL IN KS KY LA M1 M2 MA MD ME 0.58 0.87 0.89 0.77 0.05 0.25 0.10 0.00 0.00 0.79 0.75 0.11 0.78 0.97 0.05 0.87 0.89 0.83 0.87 0.13 0.28 0.03 0.03 0.18 MI MN MO MS MT N1 N2 N3 NC ND NE NH NJ NM NV NY OH OK OR PA RI SC SD TN 0.25 0.38 0.84 0.76 0.76 0.90 0.62 1.00 0.42 0.96 0.97 0.40 1.00 0.16 0.47 0.01 0.53 0.94 0.08 0.39 0.08 0.86 0.90 0.85 TX UT VA VT WA WI WV WY 0.84 0.91 0.16 0.07 0.07 0.50 0.78 0.97So, if Trump wins New Jersey, his chance of winning Alaska is . . . 58%??? That’s less than his chance of winning Alaska conditional on losing New Jersey.
Huh?
Let’s check:
> round(mean(trump_wins[,"AK"] [trump_wins[,"NJ"]]), 2) [1] 0.58 > round(mean(trump_wins[,"AK"] [biden_wins[,"NJ"]]), 2) [1] 0.80Yup.
Whassup with that? How could that be?
How could that be, indeed. It seems like the answer is just that the weak correlation between the states plus the low probability of Trump winning New Jersey is causing some weirdness in the tails of the forecast. Because of that low probability, it is tempting to brush this off as just a a minor error that won’t really happen in reality.
But actually, the problem gets worse. Andrew finds that a lot of the correlation between states in 538’s model is driven by geographic distance between states. NJ and AK are far, so they have a low correlation.
But . . . hey, what's up with Washington and Mississippi? If NJ and AK have a correlation that's essentially zero, does that mean that the forecast correlation for Washington and Mississippi is . . . negative?
Indeed:
> round(cor(trump_share[,"WA"], trump_share[,"MS"]), 2) [1] -0.42And:
> round(mean(trump_wins[,"MS"] [trump_wins[,"WA"]]), 2) [1] 0.31 > round(mean(trump_wins[,"MS"] [biden_wins[,"WA"]]), 2) [1] 0.9If Trump were to pull off the upset of the century and win Washington, it seems that his prospects in Mississippi wouldn't be so great.
For reals?
Again, we find weirdness in the tails. But it’s not actually just the tails. Check out the scatter plot between simulated Trump vote share in Washington and Mississippi:
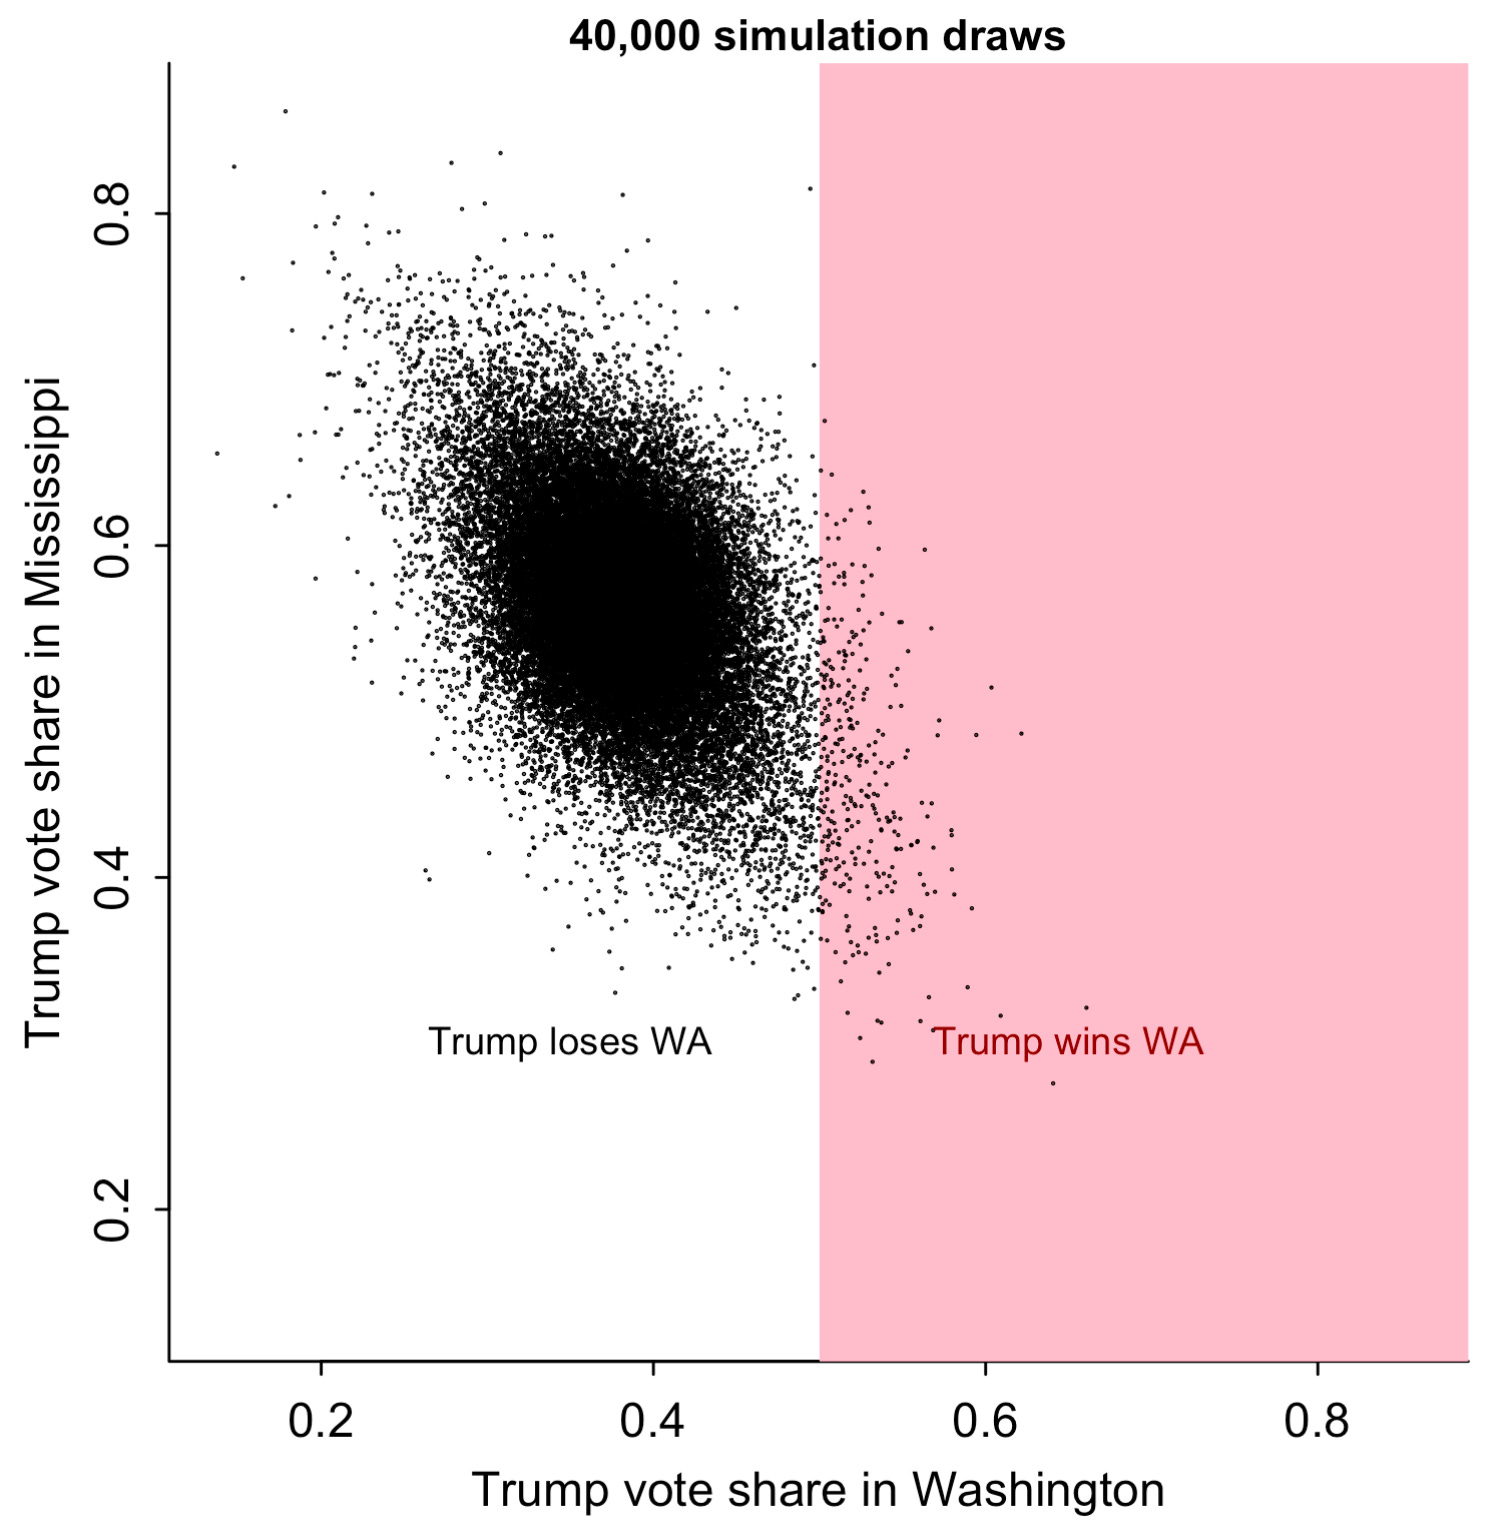
The problem is happening throughout the model. According to the 538 simulations, every point that Trump gains in Washington is equal to a 0.43 point decrease in his vote share in Mississippi.
And to review, Trump is also expected to lose big in New Jersey and probably win in Alaska. But 538’s model says that if he were to win in New Jersey, his chance of winning in Alaska would drop from 80% to 58%!
…
After Andrew blogged this, I tweeted about it and got some rather confused feedback. People were trying to rationalize the negative correlation between MS and WA by saying that there was indeed a negative correlation in their Republican vote shares historically.
That’s true, but it’s not really relevant. The target between-state correlations for the model is not the relationship between past *outcomes*, but the current between-states correlation in *polling error*. That’s because our models are supposed to simulate prediction error, not historical across-year paths in Democratic gains. And a negative correlation for residual predictive error is clearly wrong.
To understand why, just think about what the negative correlation is saying about Biden’s chance to beat the polls. A negative correlation is saying that if Biden makes gains with eg white voters in Washington over the next two weeks, or if the polls don’t have the right share of young or non-white voters that favor him there, that we should not expect similar patterns in Mississippi but actually expect the reverse. That is, 538 tells us that Biden beating his polls in WS would be a signal that he’s bound to do worse than them in MS.
Maybe that’s right in the tails, but surely not on average, and not with so strong a negative correlation as -0.4. That’s because polling error is shared across states based on demographics. If Biden is doing better than polls suggested among whites, that’s probably happening everywhere, not just in WA. And there’s no reason to suspect that the reverse would be true in states that are geographically far away.
…
This strikes me as an easy error to make (though it is still a big one). I say that because I made a similar error in an earlier version of my forecasting models! But the lesson is that we fixed the error, rather than doubling down on it.
And even if 538 maintains that the model has created good predictions in the past so the error is not important, or that the error is just in the tails (it’s not), I think it’s actually a really big deal if your model is doing something wrong under the hood. That’s true even if it is arriving at the right average prediction in each state, or coming up with reasonable electoral college simulations. (On the contrary, this might explain why Nate Silver gives Biden a lower aggregate win probability than most of the other forecasters, conditional on the having the same state toplines.)
To me, the takeaway is two-fold. First, that we should learn from such errors and fix them (which Nate seems unwilling to do). And second, that this makes sense of a large chain of errors that have added a lot of artificial uncertainty to his model. See the first line of Andrew’s post for a review of what we’ve identified so far.
To close, let me answer the titular question: “If Biden beats the polls in Alaska, what should we predict in New Jersey?” Common sense and empirical polling correlations say that he should beat the polls in both. Puzzlingly, 538 says the opposite.
PS I will be sending another subscribers-only post later today, to make up for the lack of content earlier this week. As you can imagine, the weeks are filled with work these days — but I’m committed to publishing posts for you despite that. Keep your inbox open.
I am getting more and more frightened my the minute!