Dear reader,
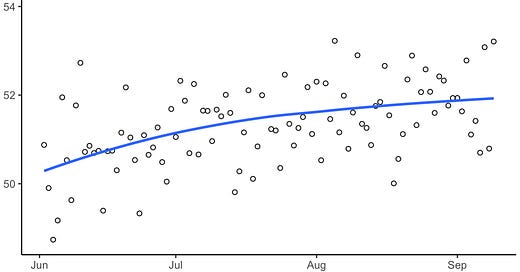
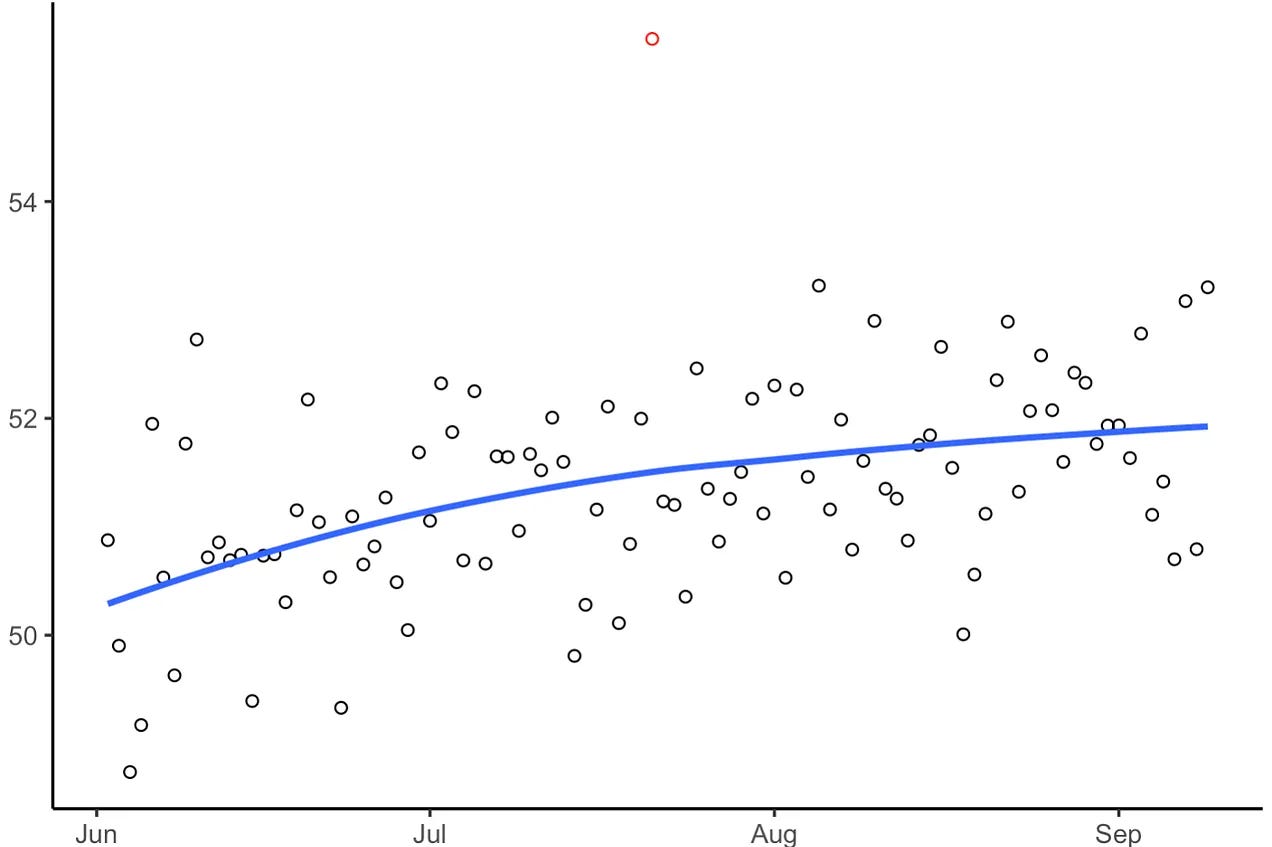
Last weekend, you may have seen a surprising poll result from ABC News (my employer) and The Washington Post. The poll had Trump up 9 points over Biden for a 2024 matchup — quite an outlier when compared to the average poll today (roughly Biden +2, per my estimates for 538).
The episode brought up a lot of good questions (and some harsh criticism) from poll consumers. How can a poll be so far off the average if it’s sampling the same underlying population? How do the crosstabs disagree so much with our priors? Is this a result of pure randomness, or something else?
I took to 538 to answer these questions in a piece that went up Tuesday afternoon. You can find it here. I go over the methodological sources of error in polls and explain why they sometimes get pushed off course, and explain how we address outlier-induced error and pollster-induced bias with 538’s aggregation models. It’s a lot like the old blog posts I used to publish here. I hope you give it a read and enjoy it.
Feel free to respond here (or via email) with comments and questions. I’ll do my best to answer them!
Elliott


Hi Elliott,
Great article on breaking down polls. I hope you can bring more data-based journalism to a broader audience at ABC/538.
I hope you are doing well and everything is going well at 538!
-Elliot
Elliot, thanks for this article. I am also interested in a candidates 'internal polling', that we often read shows different results from 'public polling'. Can you describe the main differences in the two? Or direct me to a good read that does?