


How to be better election forecasters in 2020 📊 February 9, 2020
A few things to keep in mind this year

Welcome! I’m G. Elliott Morris, a data journalist at The Economist and blogger of polls, elections, and political science. Happy Sunday! This is my weekly email where I write about politics using data and share links to what I’ve been reading and writing. Thoughts? Drop me a line (or just respond to this email). Like what you’re reading? Tap the ❤️ below the title and share with your friends!
Dear Reader,
This week’s main read: I imagine that my complaints against this analyst will be familiar to many of you at this point, but her work raises important and teachable points about election forecasting that we should keep repeating.
Plus, my commentary on some recent articles, tweets and analyses about Iowa, the Democrats and a popular myth about turnout.
Thank you for reading my weekly email! Please consider sharing online and/or forwarding to a friend. The more readers, the merrier! If you’re shy, the best way you can support my newsletter is to press the heart button below the title (this makes it rank higher in Substack’s curation). If you’d like to read more of my blogging I publish subscriber-only content 1-3x a week on this platform. Click the button below to learn more!
—Elliott
Extra extra read all about it!
I wrote a long piece last week about the future of our democracy. Give it a read and if you like it, please consider a paid subscription to my newsletter. Good writing (if you believe that’s what this is!) is worth supporting—and books ain’t free!
How to be better election forecasters in 2020
A few things to keep in mind this year
Throughout 2018, I kept track of at least six high-quality election forecasting models predicting various outcomes for the US House and Senate midterms and was aware of plenty of other analysts attempting similar analysis. We were all pretty much aligned at the end in predicting a Democratic House and Republican Senate.
Readers of my newsletter will be familiar with one of those analysts: Rachel Bitecofer, a professor at Christopher Newport University in Virginia. Dr Bitecofer quickly gained notoriety in 2018 for issuing bold predictions that satisfied certain left-leaning crowds. To the extent that political parties anoint oracles, Bitecofer has quickly become one of the left’s handful of prized soothsayers. She routinely goes on MSNBC and has a robust Democratic-inclined Twitter following.
Dr Bitecofer is in the news again this week via a profile from Politico Magazine editor David Freelander. He praises her “radical” theory of politics (that has very little basis in empirical facts) and her forecasting ability (which might be slightly above replacement-level). And it’s because she’s in the news again that I want to revisit her forecasting methods. Her style of prediction (more punditry than well-specified modelling) offers us the ability to seize on a teachable moment and hopefully emerge with a better understanding of proper election forecasting. (I talked a lot about this is a piece from last November about the “dos and don’ts of predictive journalism”.) This will be especially important if, like in 2018, we see more forecasters pop up this year. Consumers of these forecasts need to know the signs of worthwhile and subpar forecasting.
Thinking probabilistically
The biggest issue with novice election forecasters is that they (or their models) often don’t think probabilistically. They typically don’t take the chance for systematic error into account when communicating their forecasts and instead mostly rely on point-predictions or ill-calibrated qualitative ratings. And even if they do model uncertainty, they may not have a good conceptualization of what 20, 30 or 70% etc. means in real life. I myself was in this position in the 2016 election; even though my forecast gave Trump a 1-in-7 shot of winning the electoral college, I wrote about how Clinton “nearly has it in the bag” and how a massive polling failure was “very unlikely”. In hindsight, I was too certain than the data allowed for.
Dr Bitecofer suffers from a similar tendency to characterize outcomes as binary. Her 2018 election forecasts categorized US House outcomes as things that “will” and “won’t” happen. My big argument is that this failure to think probabilistically injures our understanding of reality. Indeed, it’s why Trump’s win in 2016 caught so many people off guard. I argue here, and to others publicly, that an embrace of this binary thinking is actually editorial malpractice and doing a disservice to our readers.
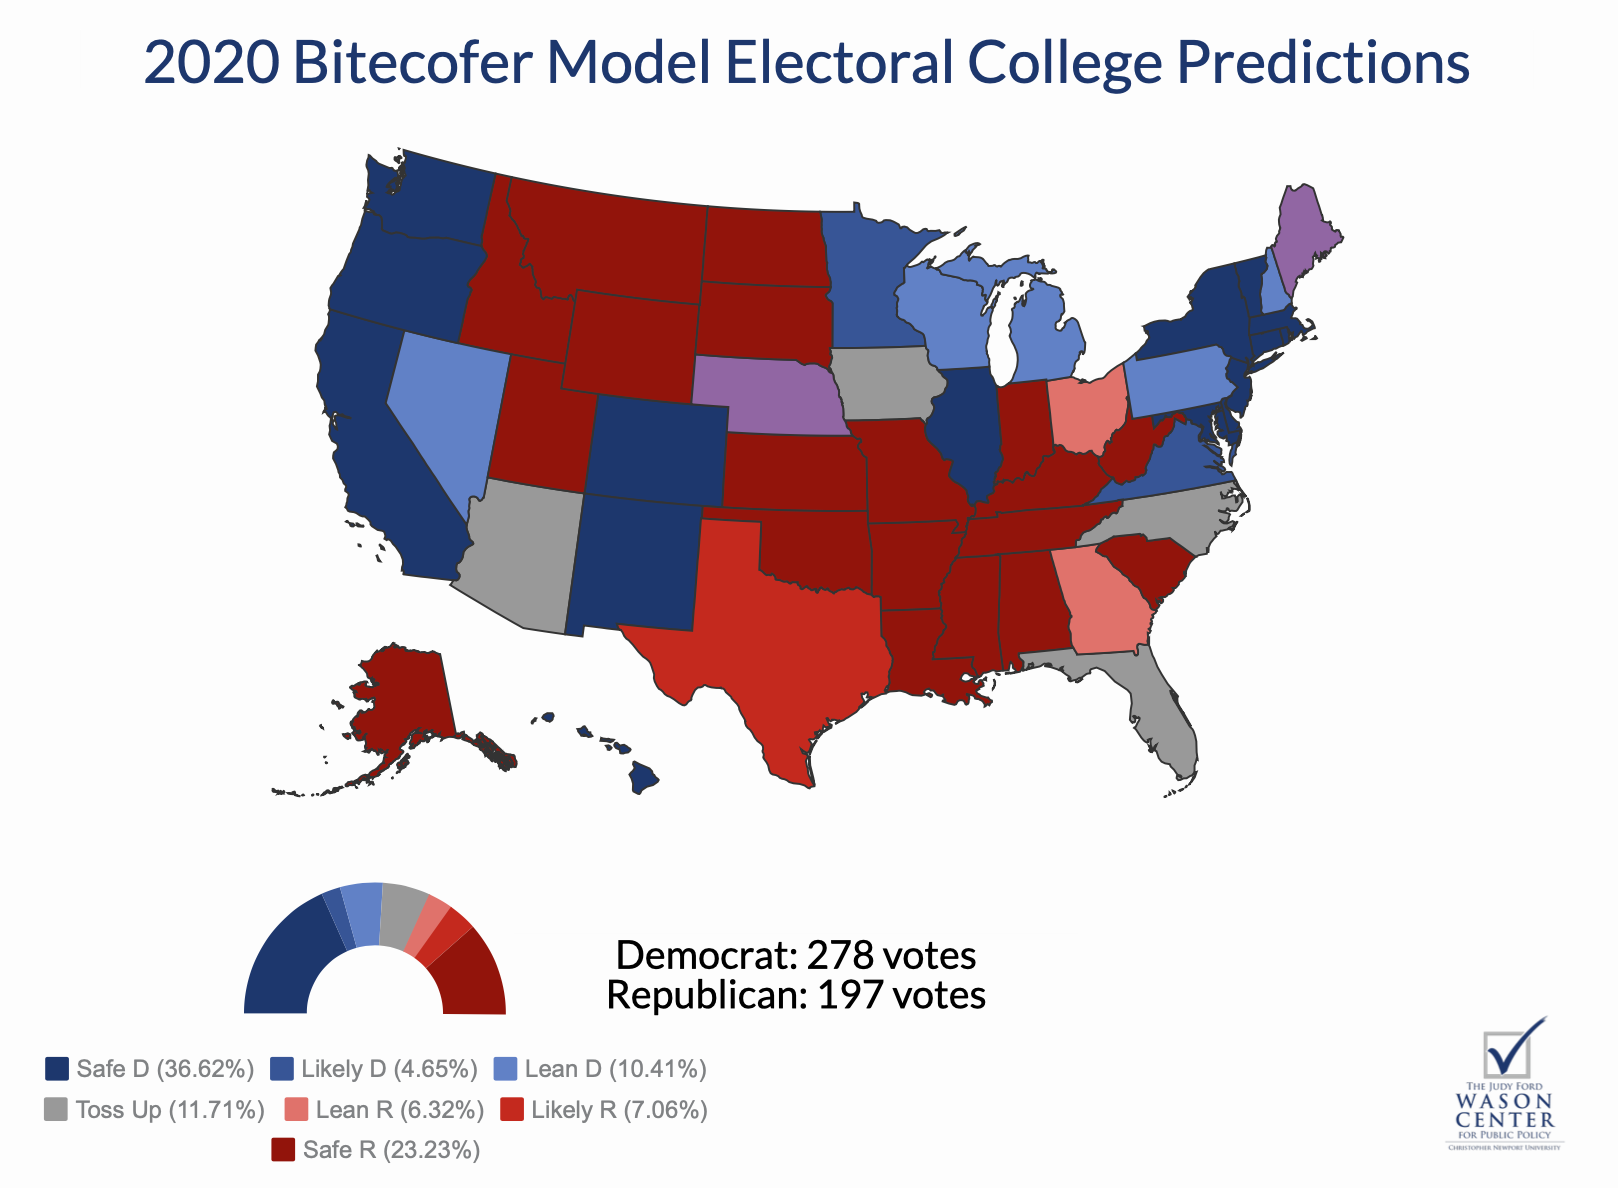
Let’s take Bitecofer’s 2020 forecast as an example of this malpractice. Primarily, it is a massive violation of this principle of thinking probabilistically. She presents a map of the US with each state scored as Safe, Likely, or Lean Democratic/Republican or Toss-up. She uses these ratings—derived from an arbitrary combination of applying a formula trained to predict the 2018 midterms to the 2020 election with some qualitative factors—to argue in the New York Times that Trump “will” lose in November.
Aggregating uncertainty
Putting aside the fallacy of this binary “will”/”won’t” thinking, how does Bitecofer get to this prediction? Specifically, how does she make the jump from individual state-level forecasts to a prediction for the electoral college? What’s the mathematical process there?
The short answer is that she doesn’t. Bitecofer said to me via email last year that there’s no underlying statistical model for her aggregate probability of Trump’s re-election. Instead, she has read her map and derived an understanding of the outcome of the race. Because Democrats are favoured in states worth more than 270 electoral votes, they “will” win the election.
This presents another teachable moment. How do we forecasters aggregate our uncertainty about individual outcomes (state-level votes for president) into predictions for the national race (the distribution of possible electoral college votes)?
Well, that’s the million-dollar question!
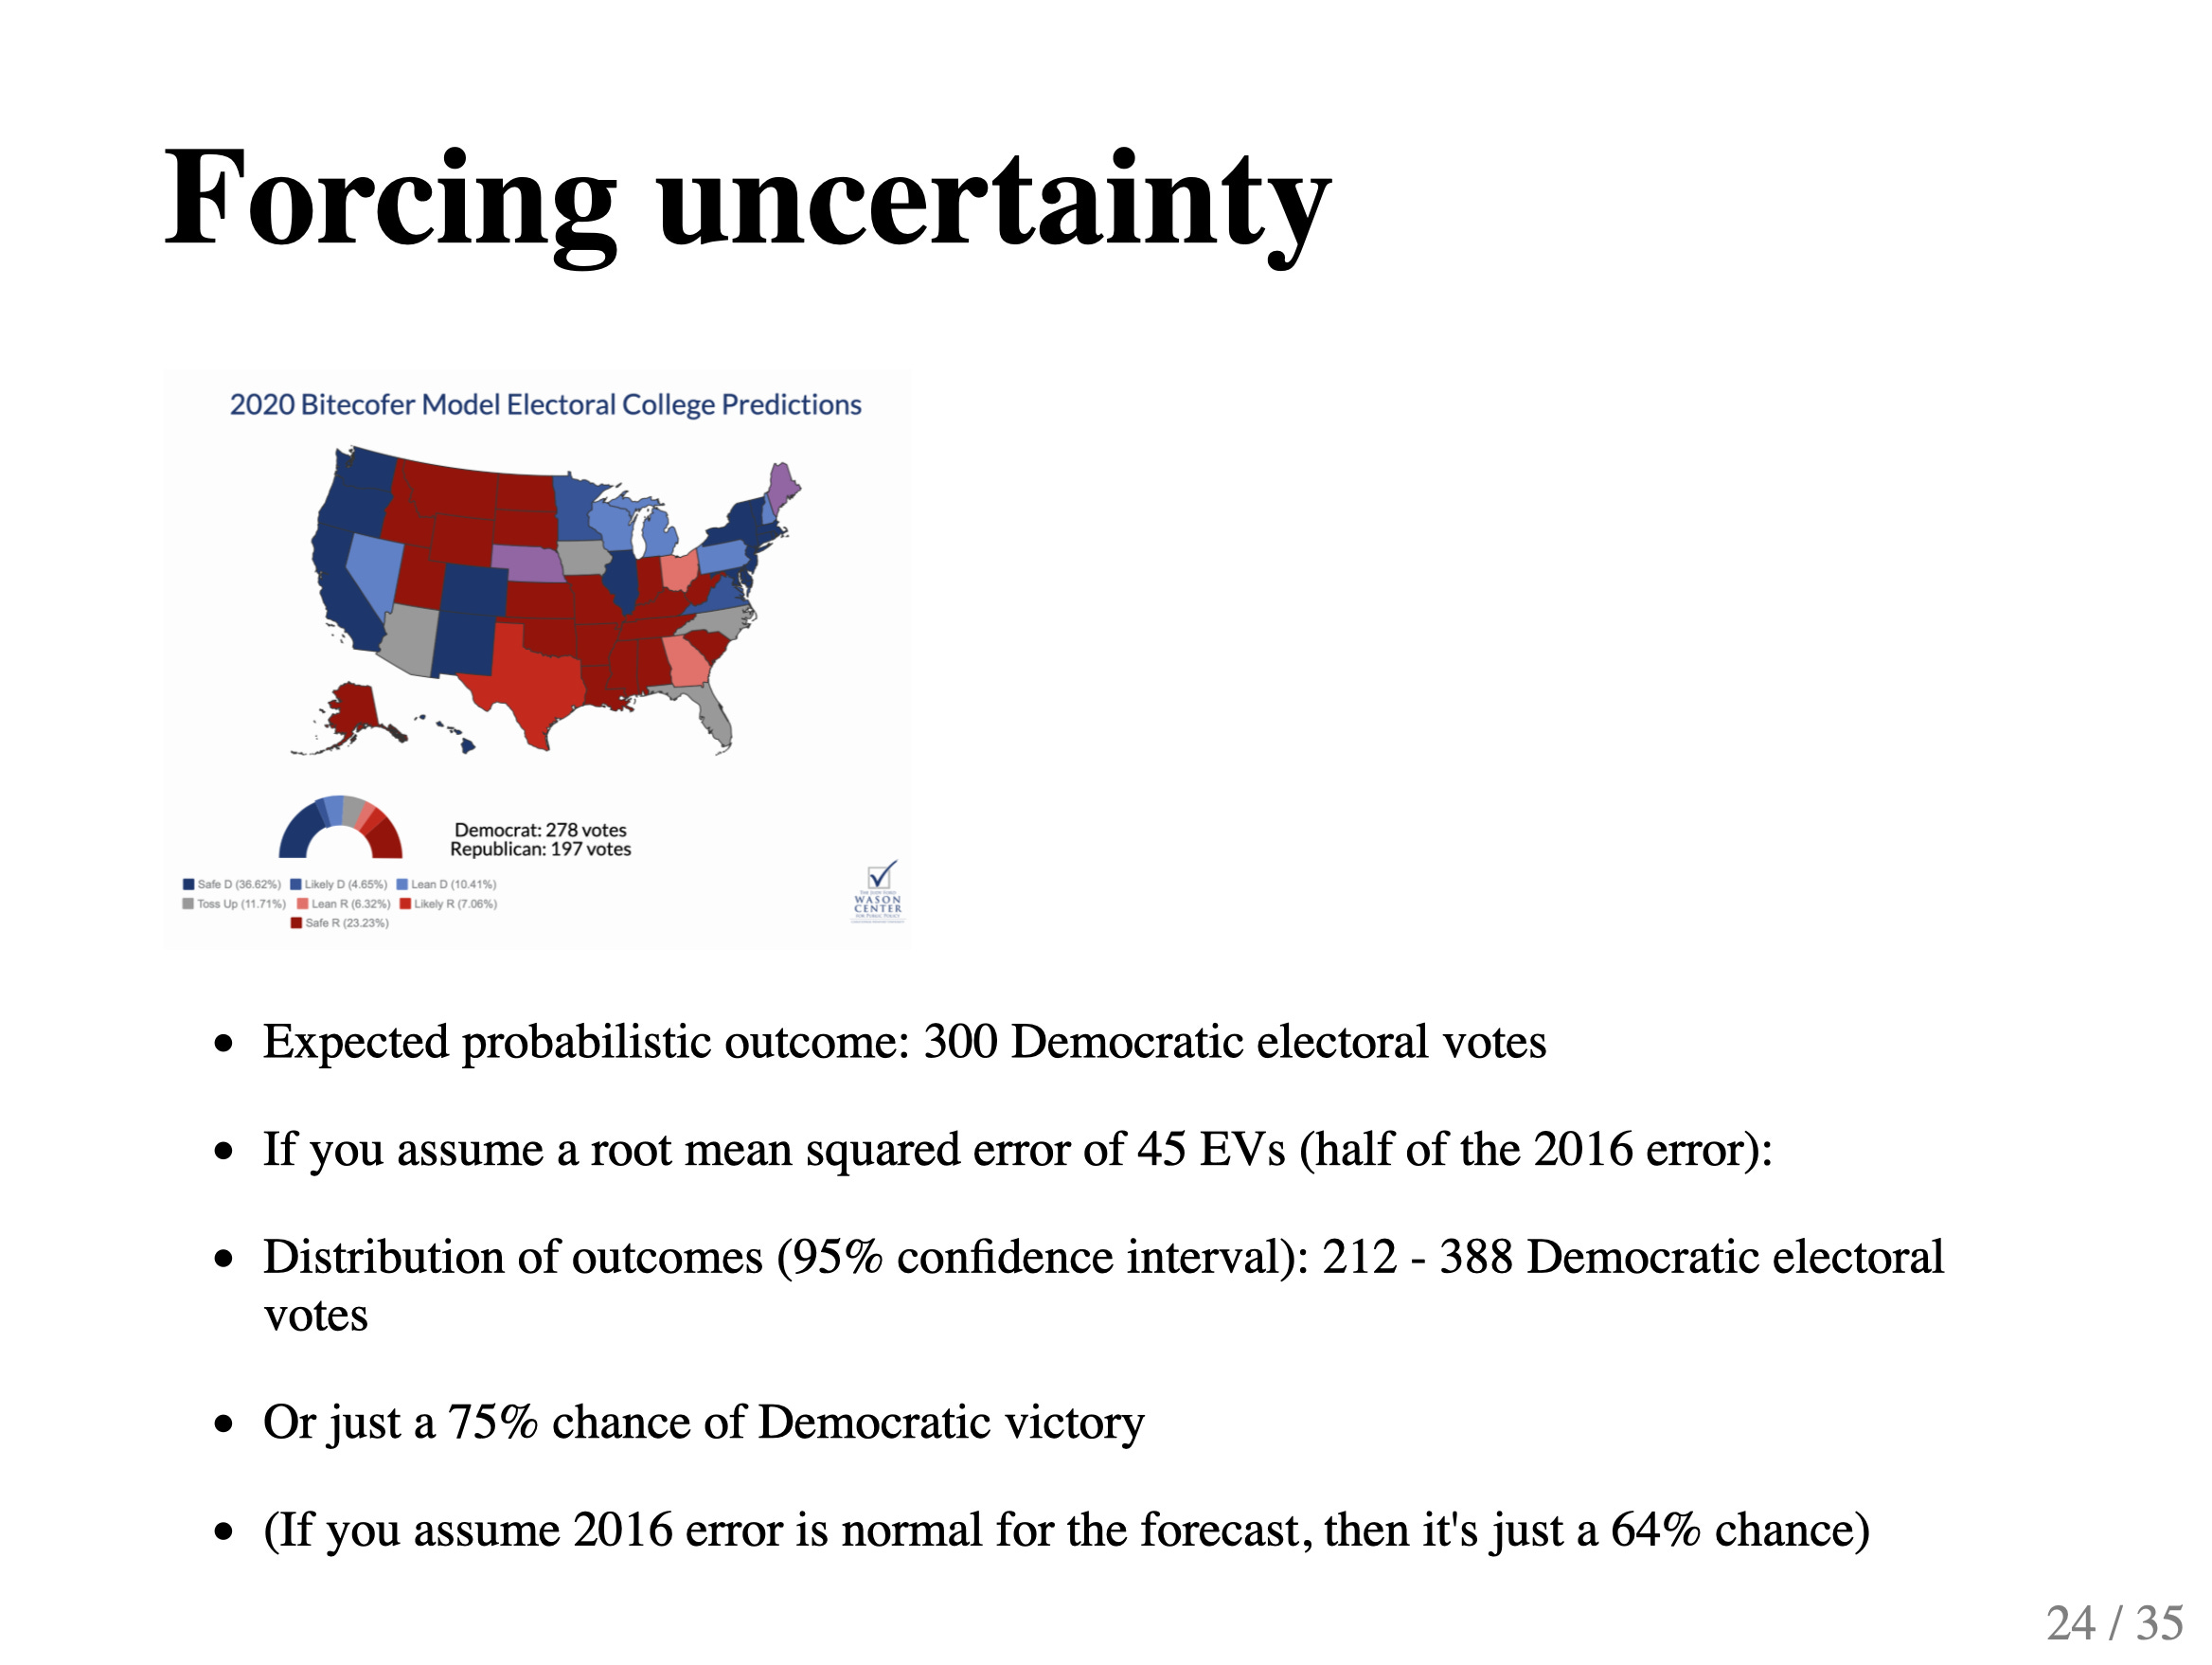
One way we can force some uncertainty upon Dr Bitecofer’s prediction is to take the predicted ~300 Democratic electoral votes (I get this by computing a sum of the number of electoral college votes assigned to each state weighted by the chance she gives that Democrats win them) and simulate what would happen under different scenarios. If we assume that the errors as large as for predictions for the 2016 election happen rarely (about 90 electoral-college votes for the Democrats, as 323 was the most often-cited forecast for Hillary Clinton but she only won 230) and simulate the election tens of thousands of times, we get a real forecast for the election.
Below is a slide from a talk I gave at George Washington University last fall that outlines the results. Bitecofer’s claim that Trump “will lose” is divorced from her data, which actually land much closer to a 30-40% chance of Trump winning re-election—again, based on simulating the error from her own predictions.
You could also derive a much more complex method for aggregating the uncertainty in your individual state-level vote predictions.
We typically do this by drawing a bunch of correlated random errors to account for the chance that polls might uniformly underestimate one party across the states, or that a candidate would gain nationwide between day t and the election day, etc.
Accounting for the “known unknowns”
The other common issue with forecasting models is that they often don’t consider enough sources of error. We know, for example, that polls don’t just have the traditional margins of sampling error—the numbers reported by individual pollsters—but that they often miss their targets (such as election results) because of non-sampling error. These are errors introduced by misidentifying the number of college-educated voters in the electorate, for instance, or the number of people that will turn out to vote.
The exact amounts of error and their directions incurred by these factors is hard to know beforehand, but we do know that we should account for them (see: 2016). A good forecaster will do so.
***
That’s all I’ve got for now. So, to recap:
Think probabilistically
Propagate your uncertainties
Account for the known unknowns
I will think and talk more about these things as the election goes on. But for now, my advice is to ignore forecasters who don’t.
And here are some selected links to the work I read and wrote last week:
Posts for subscribers:
February 4: In Iowa, a victory for new advances in polling. Polls conducted online, and even by text, performed even better than traditional phone polling
Links and Other Stuff
Turnout and ideological extremity
A common argument in favor of ideologue candidates is that the juice turnout among the party’s base. That may not be true. Read this thread:


What can we learn from Iowa
Here’s an interesting post with lots of graphs about the correlates of vote choice in the Iowa caucuses:
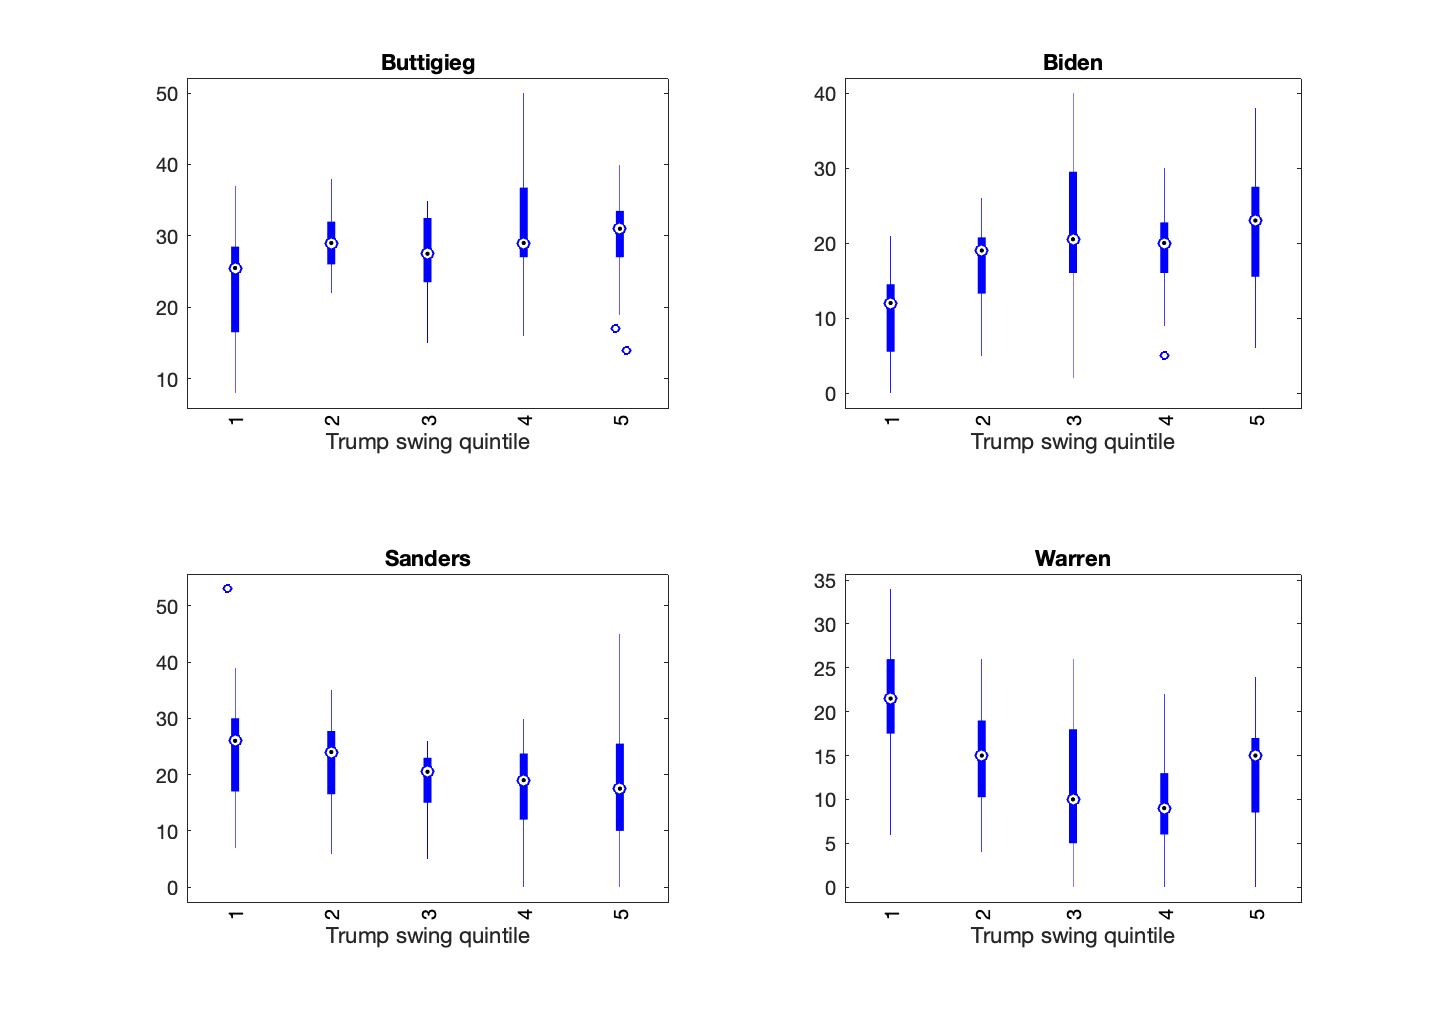
So, who should we bet on to oust Trump? If the pattern evident in Iowa holds, Biden and Sanders may both be viable against Trump. Biden is viable because he is working class and working class folk can tell that he is one of their own just by the way he talks — recall that class is passed on at your parents dinner table. As I suspected, the Biden tendency is the shadow of the class war on the Democratic primary. Sanders is viable because he does well in communities that are struggling. If you think that Trump is in the White House because large parts of the country are in trouble, and he has done little to help them, Sanders is your man. If you think that only a man who can out-blue collar Trump can oust Trump, Biden’s your guy. If progressives want Sanders instead of Biden because the former can be expected to demolish the neoliberal political economy, they must begin by losing the Boasian scold.
Ultimately, the governing question is whether culture or economics is more important to the meaning-making of the working class. For at issue in what Lind calls the New Class War, is not just the vertical and spatial polarization of value-added, income and wealth, but the concentration of symbolic production and the cultural desertification of vast swaths of America. Intellectuals have for too long paid attention to the former at the cost of the latter. It is time to pay attention to the historical sociology of the white working class — the dominant strata of American society. And to bring geography back to the center of political analysis, where it belongs.
What I'm Reading and Working On
I’m on New Hampshire duty next week. Here’s an early post about the Granite State.
Thanks for reading!
Thanks for reading. I’ll be back in your inbox next Sunday. In the meantime, follow me online or reach out via email if you’d like to engage. I’d love to hear from you!
If you want more content, I publish subscribers-only posts on Substack 1-3 times each week. Sign up today for $5/month (or $50/year) by clicking on the following button. Even if you don't want the extra posts, the funds go toward supporting the time spent writing this free, weekly letter. Your support makes this all possible!