


How election models factor in high turnout
Pollsters' likely voter screens can be flexible enough to pick up changing turnout patterns

A month or so ago, a reader named Paul wrote to me:
Hi Elliott,
Recently I've noticed differences in polls of the same state, and I have a quick question about likely voter polling: Do you know if anyone has compared the LV screens and methods used by different public pollsters?
- Paul
This is a really good question! And answering it also has the bonus of providing me with the opportunity to explain how election forecasting models can factor in the high turnout we’re seeing in early voting data. But let’s take this one step at a time.
First, let me briefly touch on how a poll of likely voters even works. There are two main ways that pollsters get samples that are representative of the likely electorate. The primary method is to simply ask people if they’re going to turn out and then subset the poll to respondents who say yes. But this is, of course, only a crude approximation. Because we know that people are prone to overestimate their likelihood of eventually casting a ballot, many pollsters will ask people to rate their intention to vote on a scale from ‘not likely to vote’ to ‘will definitely vote’ (or ‘already voted’). Then, the poll gets limited only tot hose who have already voted or are very likely to do so.
The second way pollsters can take potential turnout into account is by modeling respondents’ likelihoods to vote. They do this by matching up interviews to public records on past turnout, predicting respondents’ likelihoods to vote based on various demographic attributes and political and geographic data. Vote history is taken into account such that habitual voters are assigned high vote likelihoods, and new registrants get predicted scores based on how well they fit the profile of a voter in a comparable election. You can also mix these modeled scores with voters’ self-reported likelihoods to leverage both sources of information and to guard against overfitting to past turnout patterns.
There is more we can say, but I think that answers Paul’s question. Now on to the more news-driven angle.
…
According to data compiled by Michael McDonald, a political science professor at the University of Florida, over 26m early or mail-in votes have been cast for November’s election so far. That’s nearly 1/5th of the total turnout in 2016, which is pretty impressive. See this site from McDonald for more data, including this map:
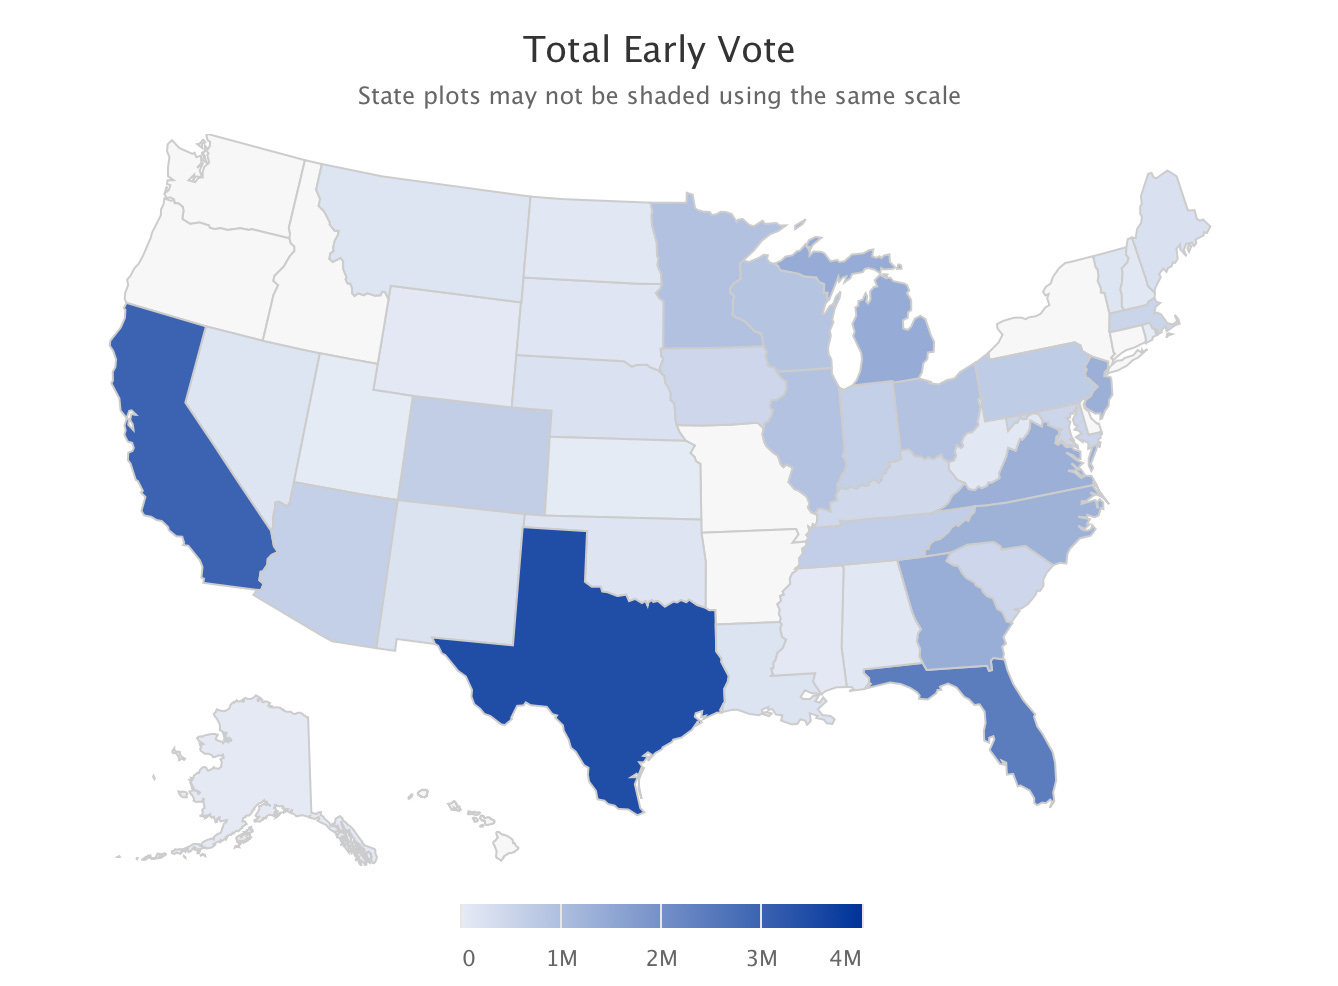
These data have prompted a lot of people to ask me whether election forecasting models take high turnout into account. The answer is yes, though not via the early vote data directly. Because pollsters take high turnout into account in their likely voter screens, including breaking out likelihood by whether people have already voted, our models that ingest polling data will pick up on whatever consequences for the November vote that the early voting data indicate.
That’s good, because there are also some significant limits to incorporating data on early voting into our models directly. Not least of them that (a) the pandemic and (b) Donald Trump’s polarization of vote methods have upset any useful historical patterns.