


Exponential social sorting and the Democratic dilemma
Higher cross-issue attitudinal factionalism means less success for progressive economic populism

There are many academics who make my job easier by (a) sharing data online or (b) tweeting charts of their findings so I can editorialize without coding stuff up myself. Charles Franklin and Lee Drutman do both. Thanks, Charles and Lee!
I know, I know. Twitter sucks. But I promise I won’t send you there — and people like Franklin, a political scientist and pollster at the Marquette University Law School in Wisconsin, share enough good information to make the sunk time worth the cost. So here’s something he posted this week that I thought we could talk about:
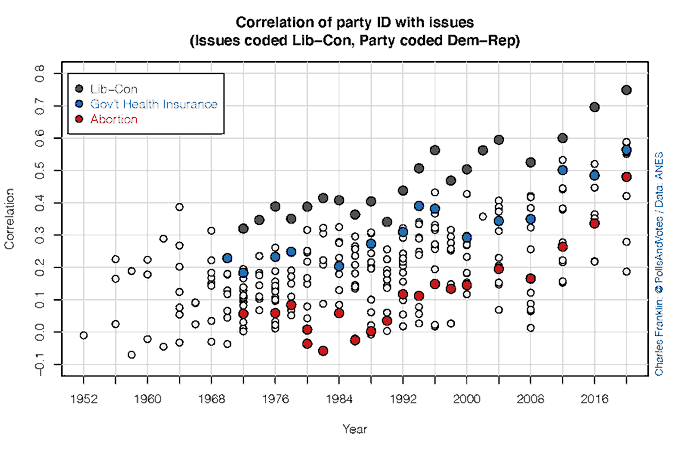
The graph above illustrates the quadriennial election-year correlation between survey-takers’ party identifications and their positions on a range of issues, as well as with their ideological self-placement. Higher marks mean there’s a closer match between someone’s preference on, say, government health insurance and their partisanship, whereas lower marks indicate a looser relationship. The general upwards trends from around 1980 indicates an increase in partisan sorting of policy preferences.
Most of these increases are linear over time. The grey dots showing the match between self-described ideology and partisanship are the best example. But the red dots, which represent the math between partisanship and abortion attitudes, form a more exponential curve — especially relative to the levels in 2000. The rate of change in the correlation between political identity and whether “the government should
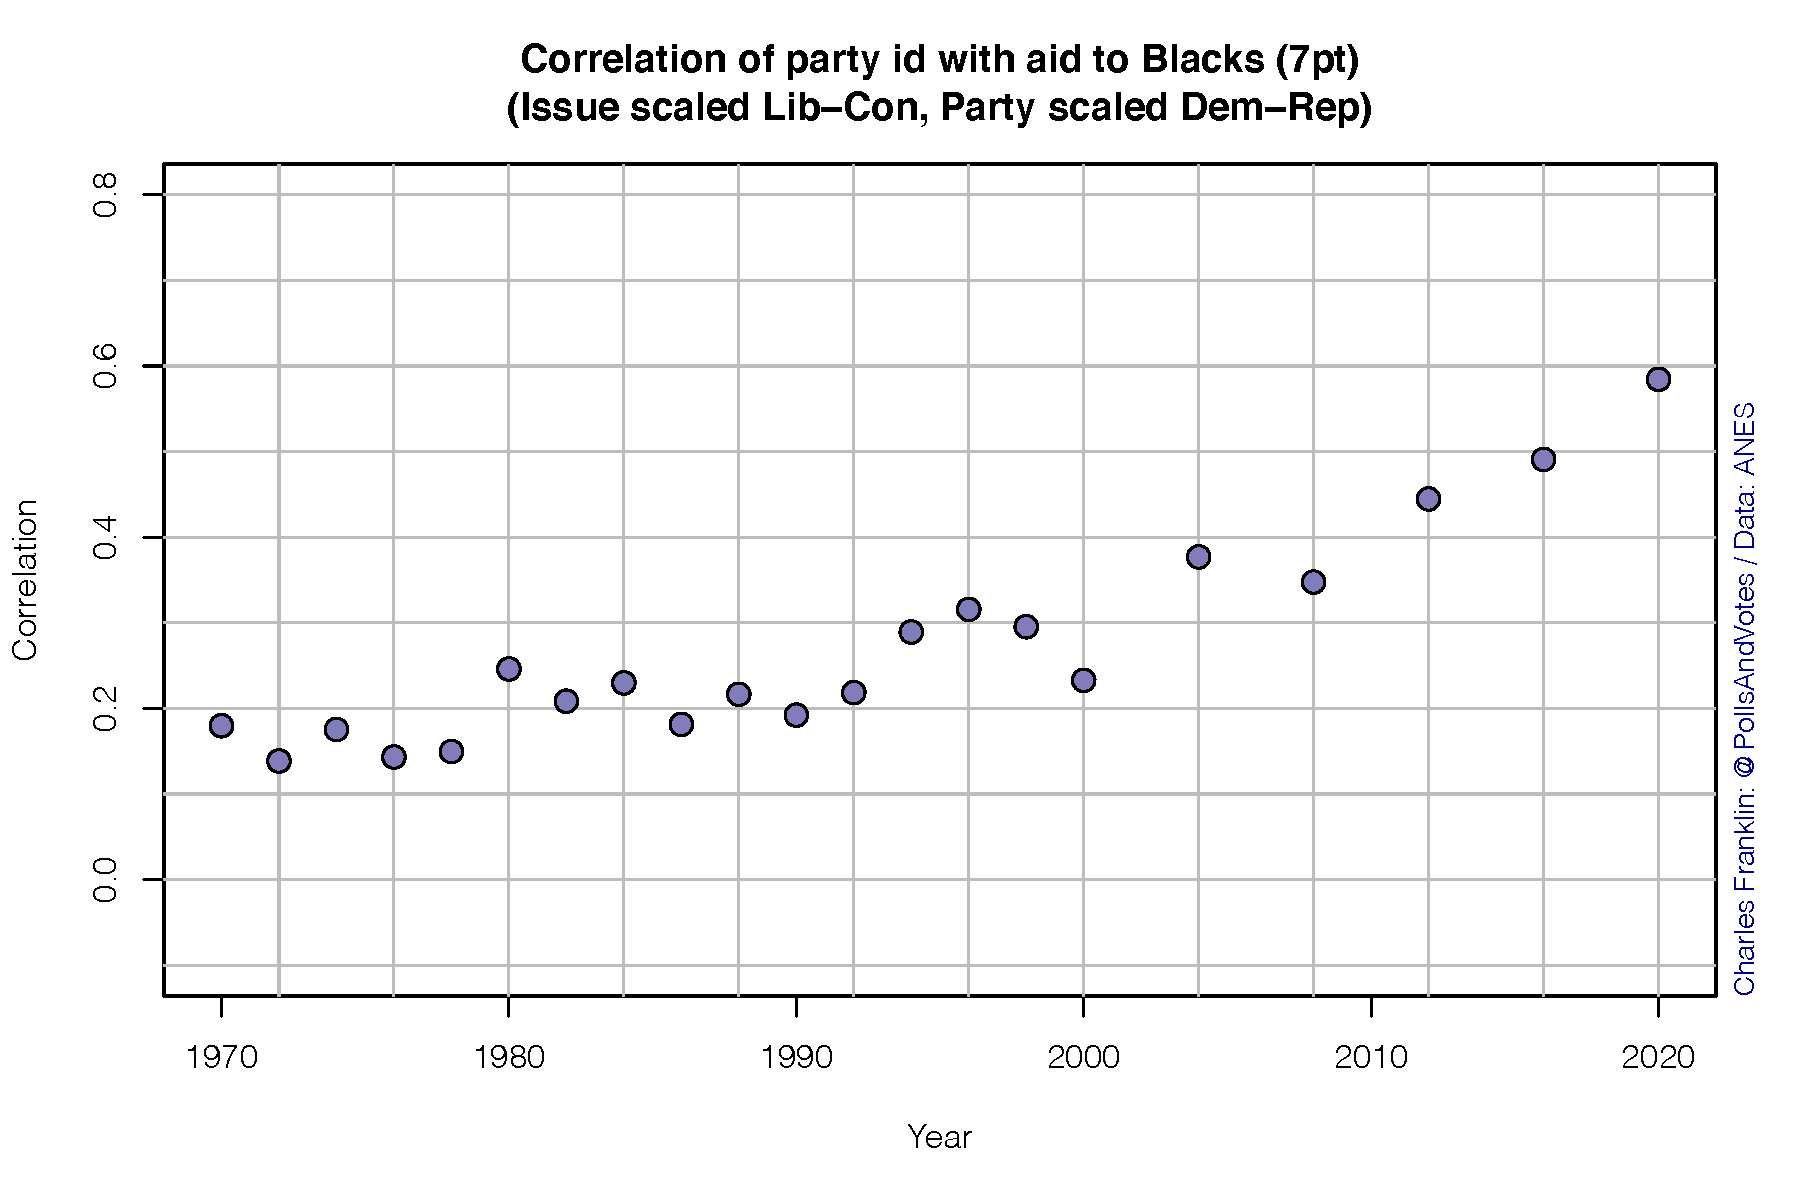
not make any special effort to help blacks because they should help themselves” has also shot up since 2000, though not at so quick a pace.
But the political chart makers didn’t stop there! Lee Drutman, a senior fellow at the New America Foundation and author of a great book on multiparty democracy in America, has a piece in the Times this week that allows you to take a quiz and see your own placement in two-dimensional ideological space. The quiz is based on questions from the Voter Study Group, so you can see the positions of thousands of other Americans too. People are represented by dots in this chart, and Lee (or the graphics designers at the NYT) have clumped them into six different groups to represent different hypothetical political parties in America:
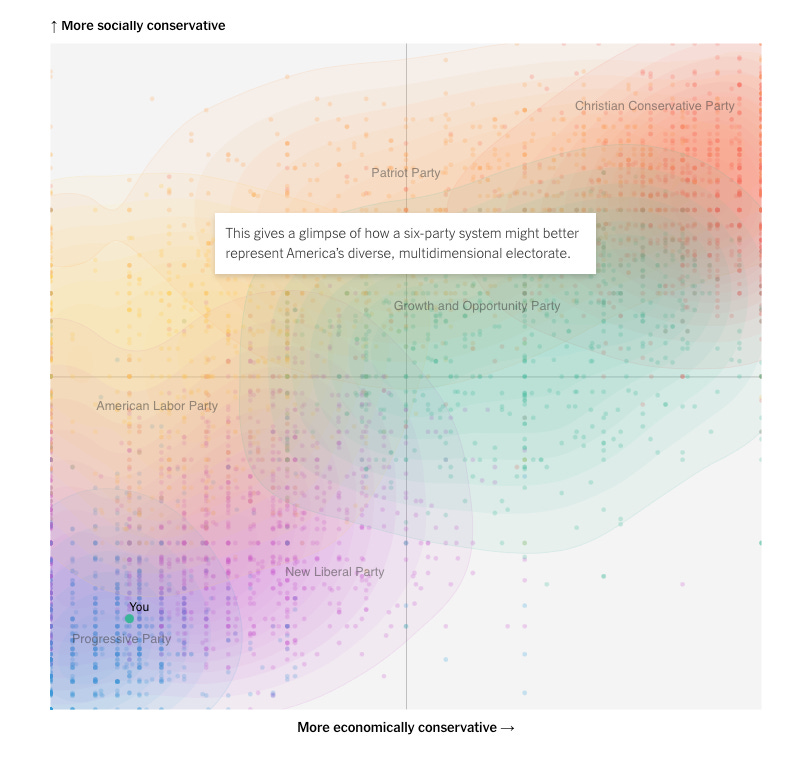
The colors and party names are nice — perhaps with the exception of the positively valenced and nebulous “Growth and Opportunity Party” — but the blobs nearly obscure a broader point here: the lack of people in the upper left and bottom right quadrant. What we see in Franklin’s graph is reflected in Drutman’s, as clumping near the central y=x line represents tight social sorting. Drawing the line could make it clearer:
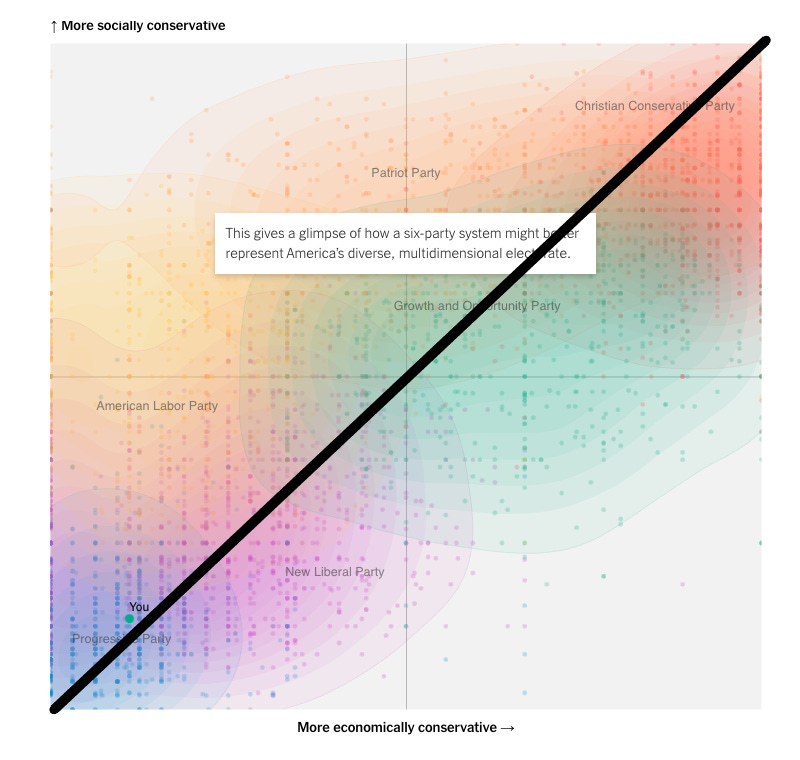
Note that most Democrats and Republicans lie not only close to this line but on the poles. Yet there is one important exception: the big deviation from the trend in 2-dimensional polarization is the voters Drutman calls members of the “American Labor Party”. These economically progressive, socially conservative voters tend to vote for Republicans, despite their views on monetary and fiscal policy. Here are two more graph from a 2017 report by Drutman:
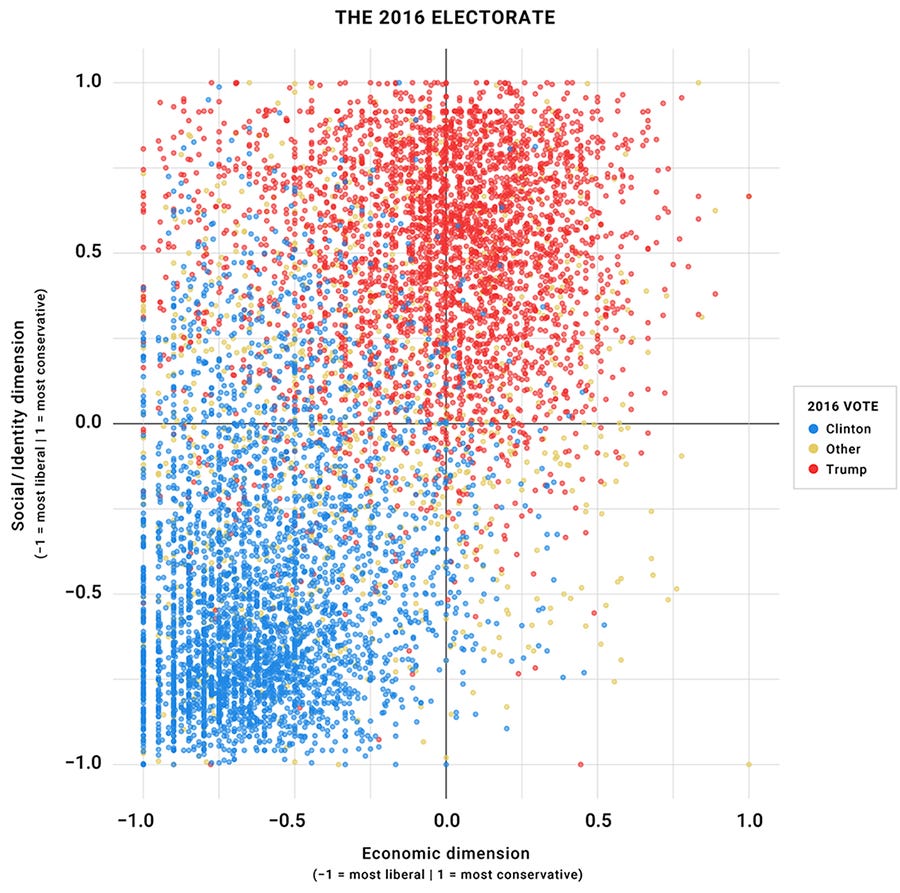

The top left quadrant is the “populists”.
It is worth a few remarks on the history of this quadrant. First, there used to be way more of these voters, and they used to vote much more for the Democrats. The collapse of the upper left quadrant is a big reason for the Democrats’ weakness in the South after 1960, and in the Midwest after 2004. One reason is the increased educational polarization in America: the Times’s Nate Cohn published the following chart of Democratic presidential vote share by white educational attainment in a piece this week. Part of this story is white northeastern voters used to be more aligned with economically progressive union interest groups in the Democratic party, but the decline in socially conservative national Democratic figures and courting of non-college-educated voters from Republicans have pulled them to the right.

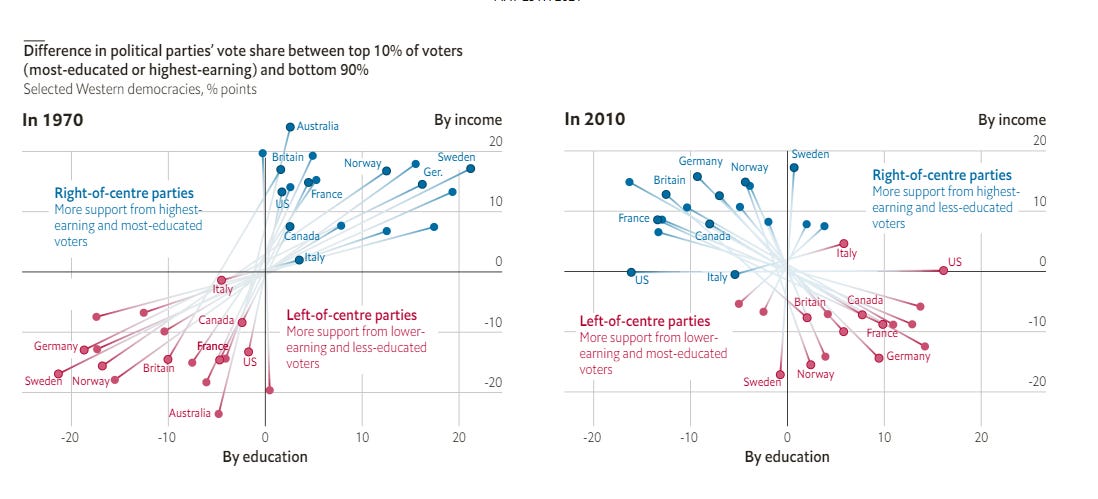
This is a surprisingly international shift, by the way. Here is a graph from The Economist showing the global increase in educational polarization since 1955. (Note the reversed color scheme.)
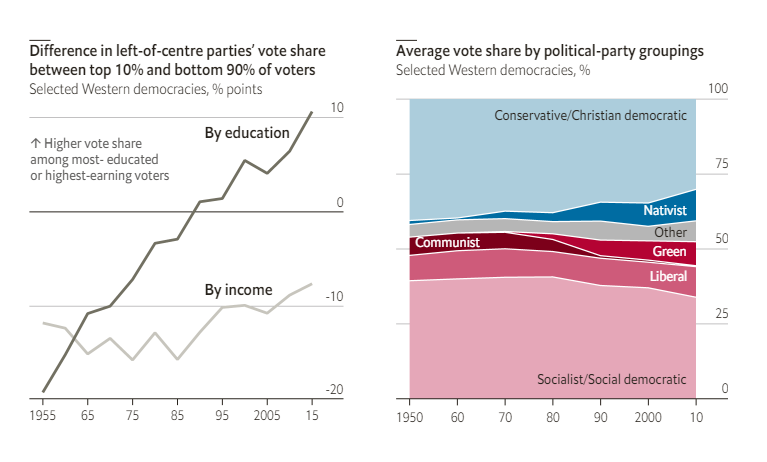
And the US is an outlier way above the trend, with income polarization in 1970 being almost completely replaced by education polarization today. There used to be two parties separated by both wealth and income in a positive correlation; now, wealthy,e educated voters tend to be left-leaning and poorer, less educated lean to the right.
There are many implications from this, and a few to package it all together in this post. My immediate takeaway is to suggest if federal Democratic politicians stay their course, these forces will likely present a short-term problem for them. That’s because educational polarization has coincided with an increase in the salience of social issues, as well as their stickiness to partisan and ideological labels. On many of those social issues, Democrats do not have popular enough positions on economic issues that push marginal voters over the edge to overcome weaknesses on the culture war. This is particularly true in the states that are overweighted in the Senate and Electoral College. Remember, there aren’t a whole lot of Democrats in that upper left quadrant of that chart.
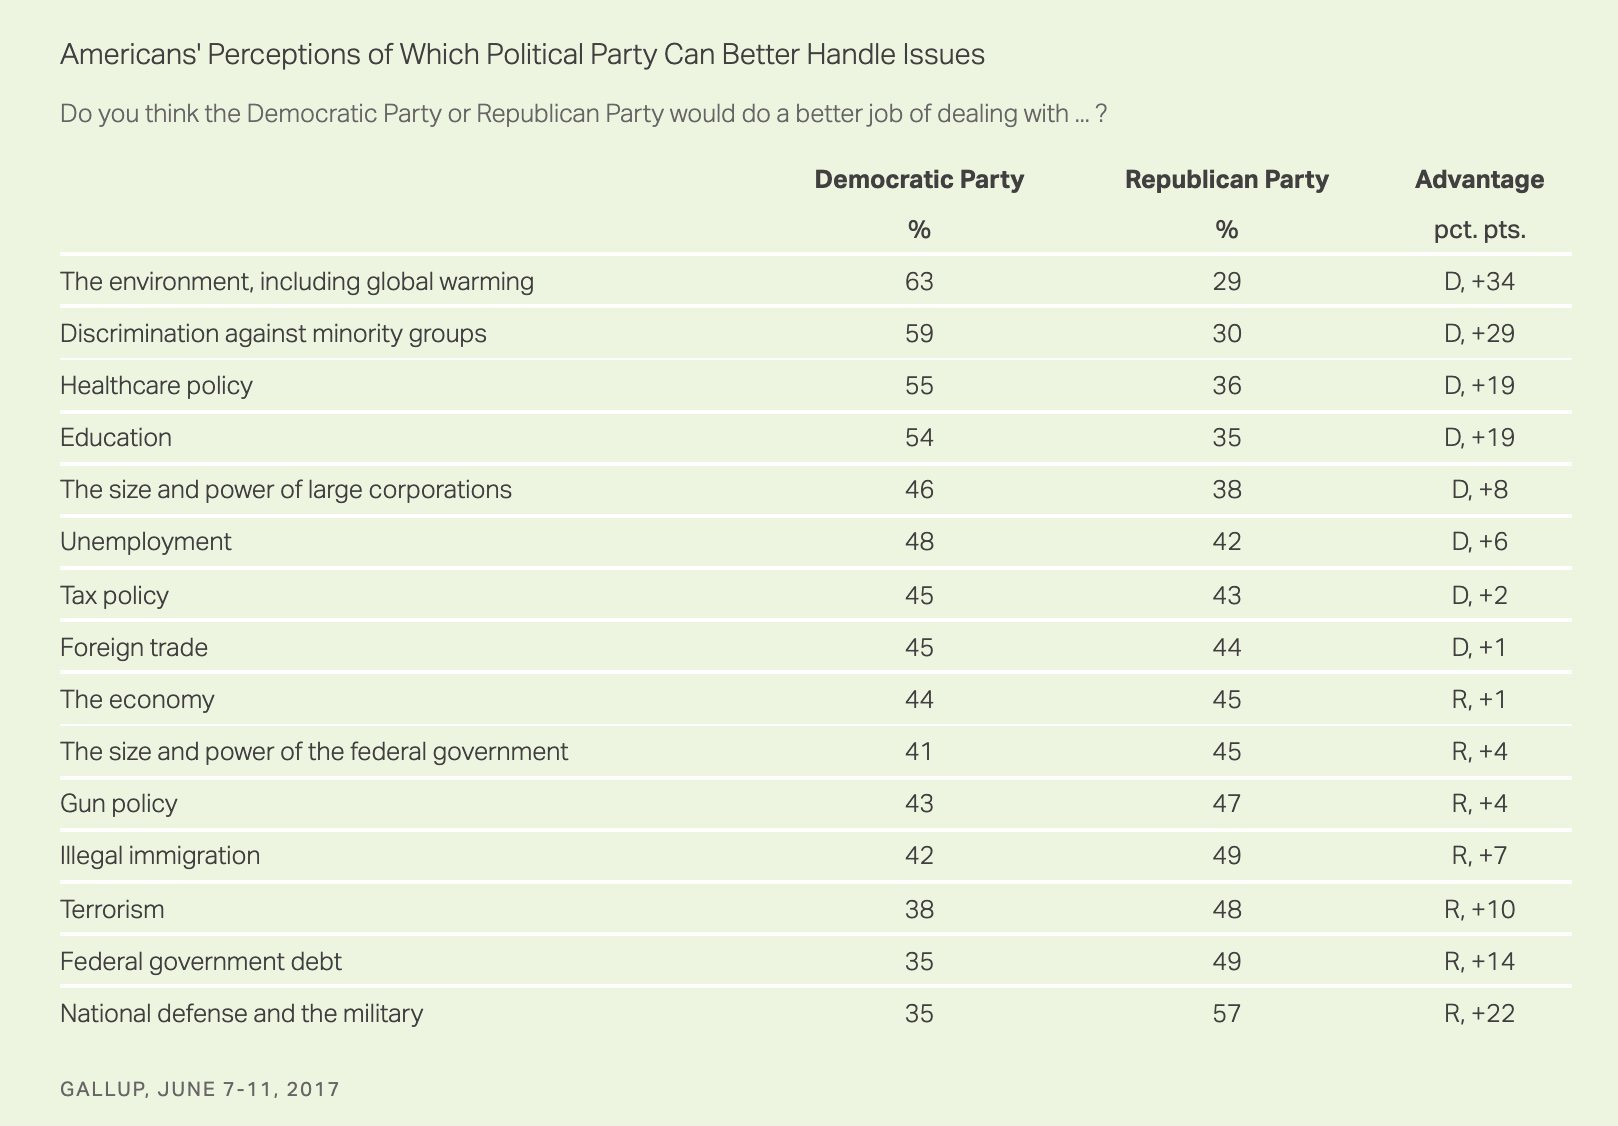
And here’s polling from Gallup showing which party has the advantage on which issue:
That’s not to say Democrats will never elections — they did in 2020, and the future is uncertain — but just that they’ll do worse on average than in a world without educational polarization pushing down the importance of class solidarity on economic issues, one of the left’s strongest sources of support in the latter half of the 20th century and early 21st.
Still, I am aware that we risk making too much of spatial alignment on any one issue. It’s the aggregate placement that counts. But even then, as the strength of identity grows, the individual impacts of preferences for any given policy shrink. This too could be particularly problematic for Democrats in the Midwest, where non-college whites are still the largest block of voters by far and hold both Republican-leaning identities and issue preferences. Over the past two election cycles, I think we have observed that economic progressivism — populism, even — can only get a candidate so far. The weakness of Elizabeth Warren’s campaign was always that she was identified (ie by voters) as more socially liberal than more “electable candidates”, even while her “extremist” agenda of wealth taxes and redistribution was popular, at least according to the polls. Yet even Joe Biden, who ran on the largest expansion of the federal government in nearly 60 years under the banner of moderation, still lost non-college whites — along with most of the voters in the upper quadrant of these so-called Labor Party voters.
…
In the end, the political consequences of these dual trends — factionalism of political identities and educational polarization — and aren’t my main concern. Mass psychological tribalism and the ensuing institutional breakdown are. So, what can we do to fix things? To unstick voters’ commitments to parties at the expense of more (but not completely!) rational preference formation — and have a positive impact on government outcomes?
Unfortunately, I don’t think much is all that feasible, as I wrote last week. Reforming the electoral system in a way that incentivises politicians to represent all these different clusters of voters, in all four quadrants, would be a big step in the right direction. That is not likely to happen anytime soon. Instead, we will likely see more ideological consolidation and educational polarization in the coming years.
That’s depressing. I’d like to end on a happier note. I guess overall I am glad we have people like Charles and Lee to crunch data and make great charts for us to interpret and analyze when we’re running late on a deadline and want to write about interesting and important trends. Thanks, y’all!
Until next time. E
I think that Putnam's data is relevant here. How we get back to any kind of face to face engagement is not clear, but his notion that personal engagement works is, I think, spot on. I was once on the cutting edge of this when we worked out of Princeton to put 70,000 students into campaigns for anti-war candidates and Bill Murphy and I wrote the handbook for the movement for a new congress Vote Power (Prentice Hall 1970 and Doubleday 1974) and later with the Downtown Independent Democrats and statewide New Democratic Coalition in New York. There were a handful of campaigns in 2018 and 2020 that, as in my self-published "Putting People Back in Politics" really did that, and some of those organizations persist, but it's tricky. I'm just writing the last chapter of the third edition on New York Politics (for Cornell) and wresting with this issue, but I do firmly believe that the more we work from the bottom up than the top down the better we mitigate this polarization. Anyway, thanks for this dispressing but vivid depiction of the problem we face.
It's crucial to fund and deploy a vigorous, rigorous public education system, and punish propagandists who use social media to gaslight critical thinking.