


Are state polls underestimating Joe Biden?
National polls have recently swung toward the president, but state polls haven't. Which have been better historically?

It’s starting to be that time again when I receive an endless stream of emails and Twitter DMs from people who refresh our election models every minute and ask what happened whenever anything changes—anything at all.
It can be a bit overwhelming, but one positive of all the messages is that I get a lot of really good questions about the election.
One of the most common questions I’ve been getting is about the emerging divide between state and national polls. You can see the dynamic most clearly in the following chart from The Economist’s election model. The points show national polls, while the trend line is the projected share of the vote in national polls.
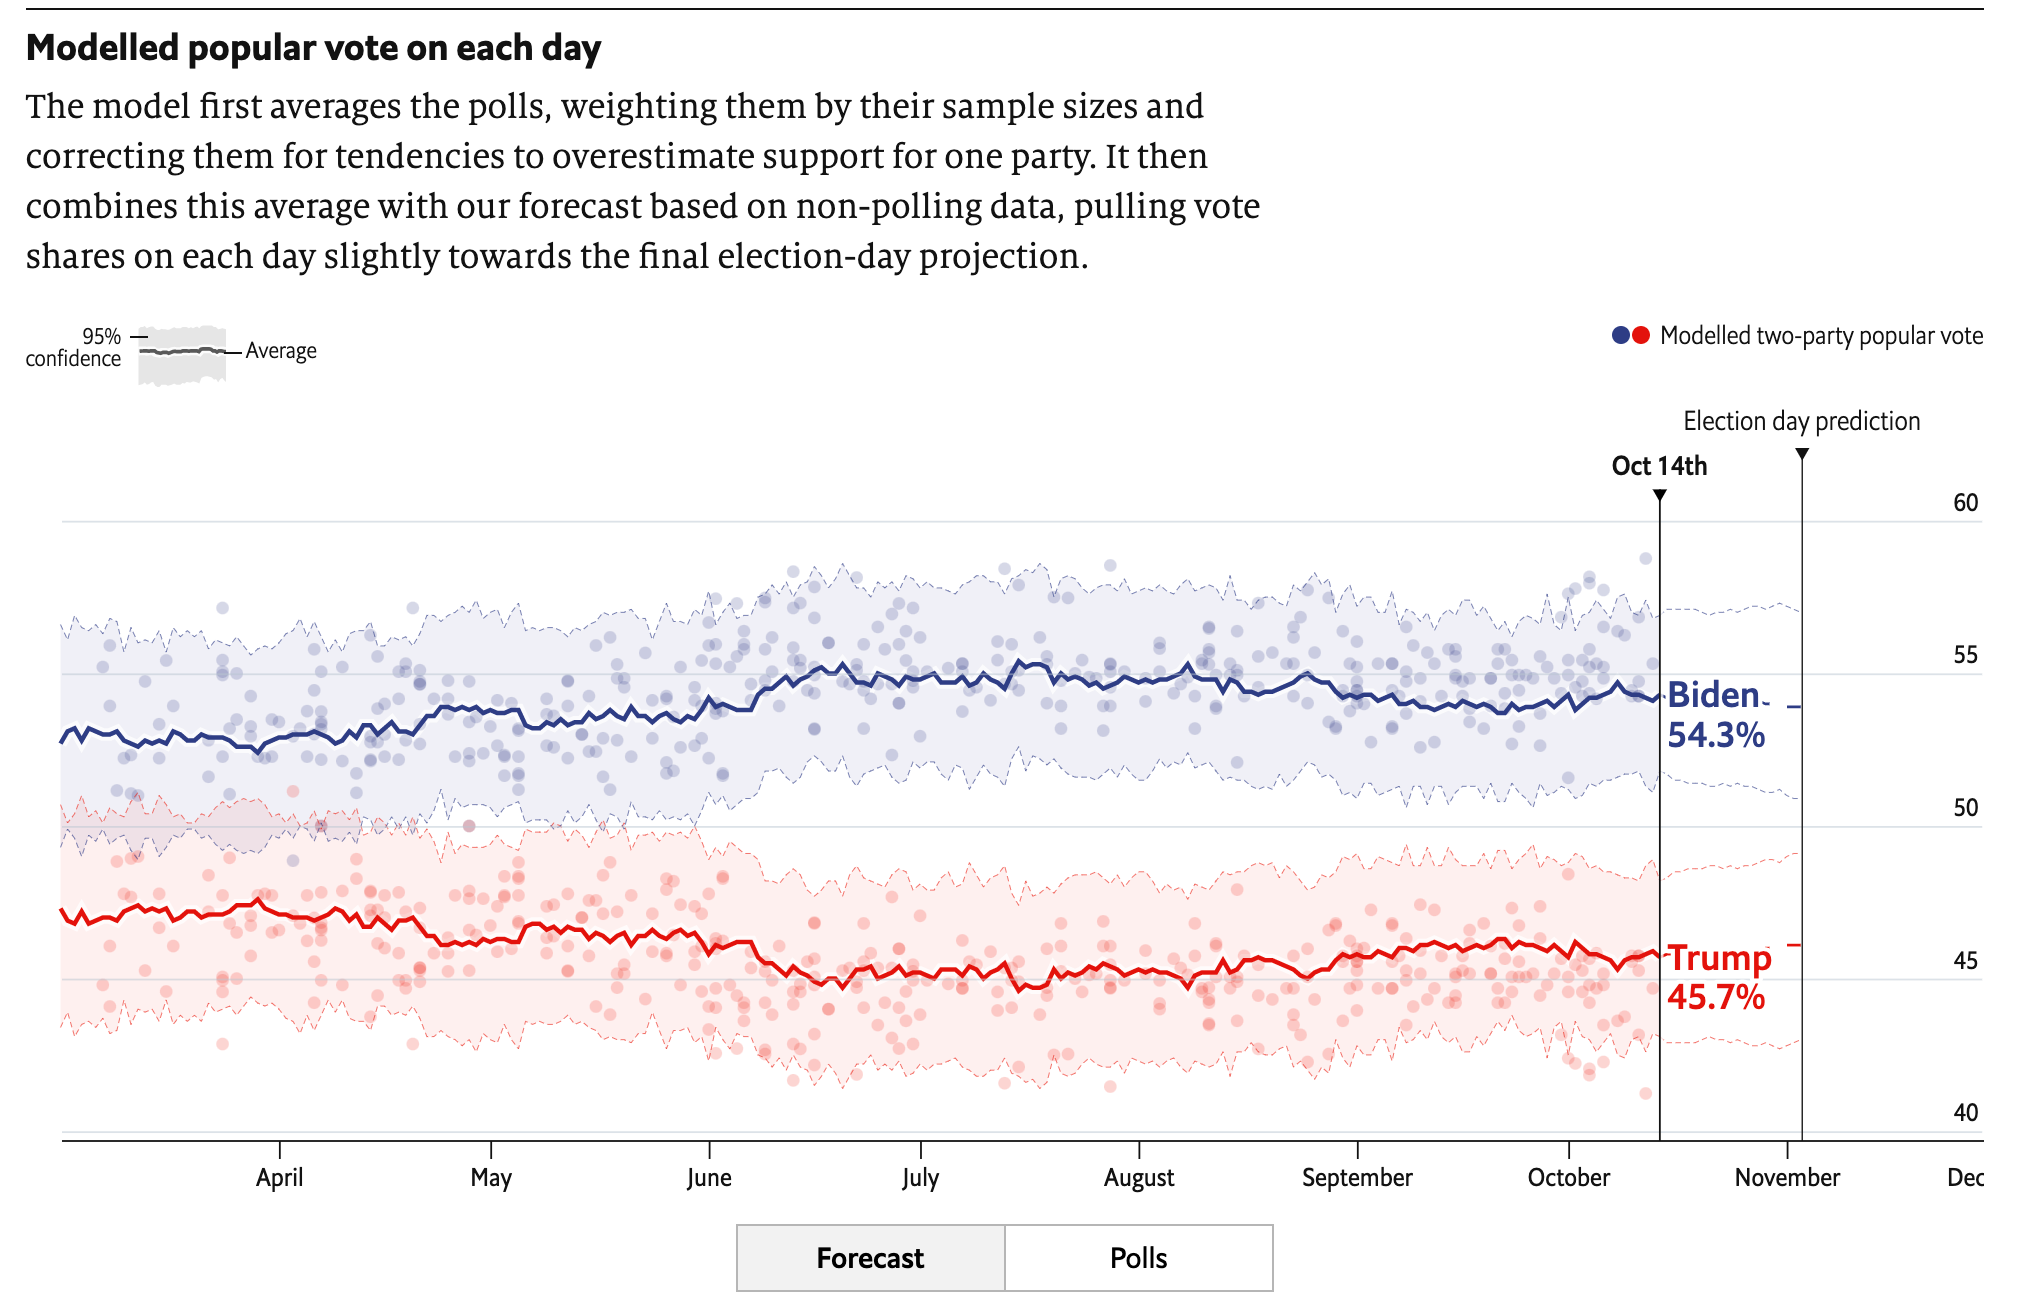
If you squint, it looks like the trend since October should be at about one point higher than it is. Perhaps something like this:

So what explains the difference? Why is the estimated national vote so much lower than the national polls?
Editor’s Note: This is a paid post for premium subscribers. If you are a subscriber and have friends or family that you think might learn something from this post, you should feel open to forward it to them regardless of their membership—but if you’re a free reader who got this from a friend, consider signing up for posts by clicking the button below:
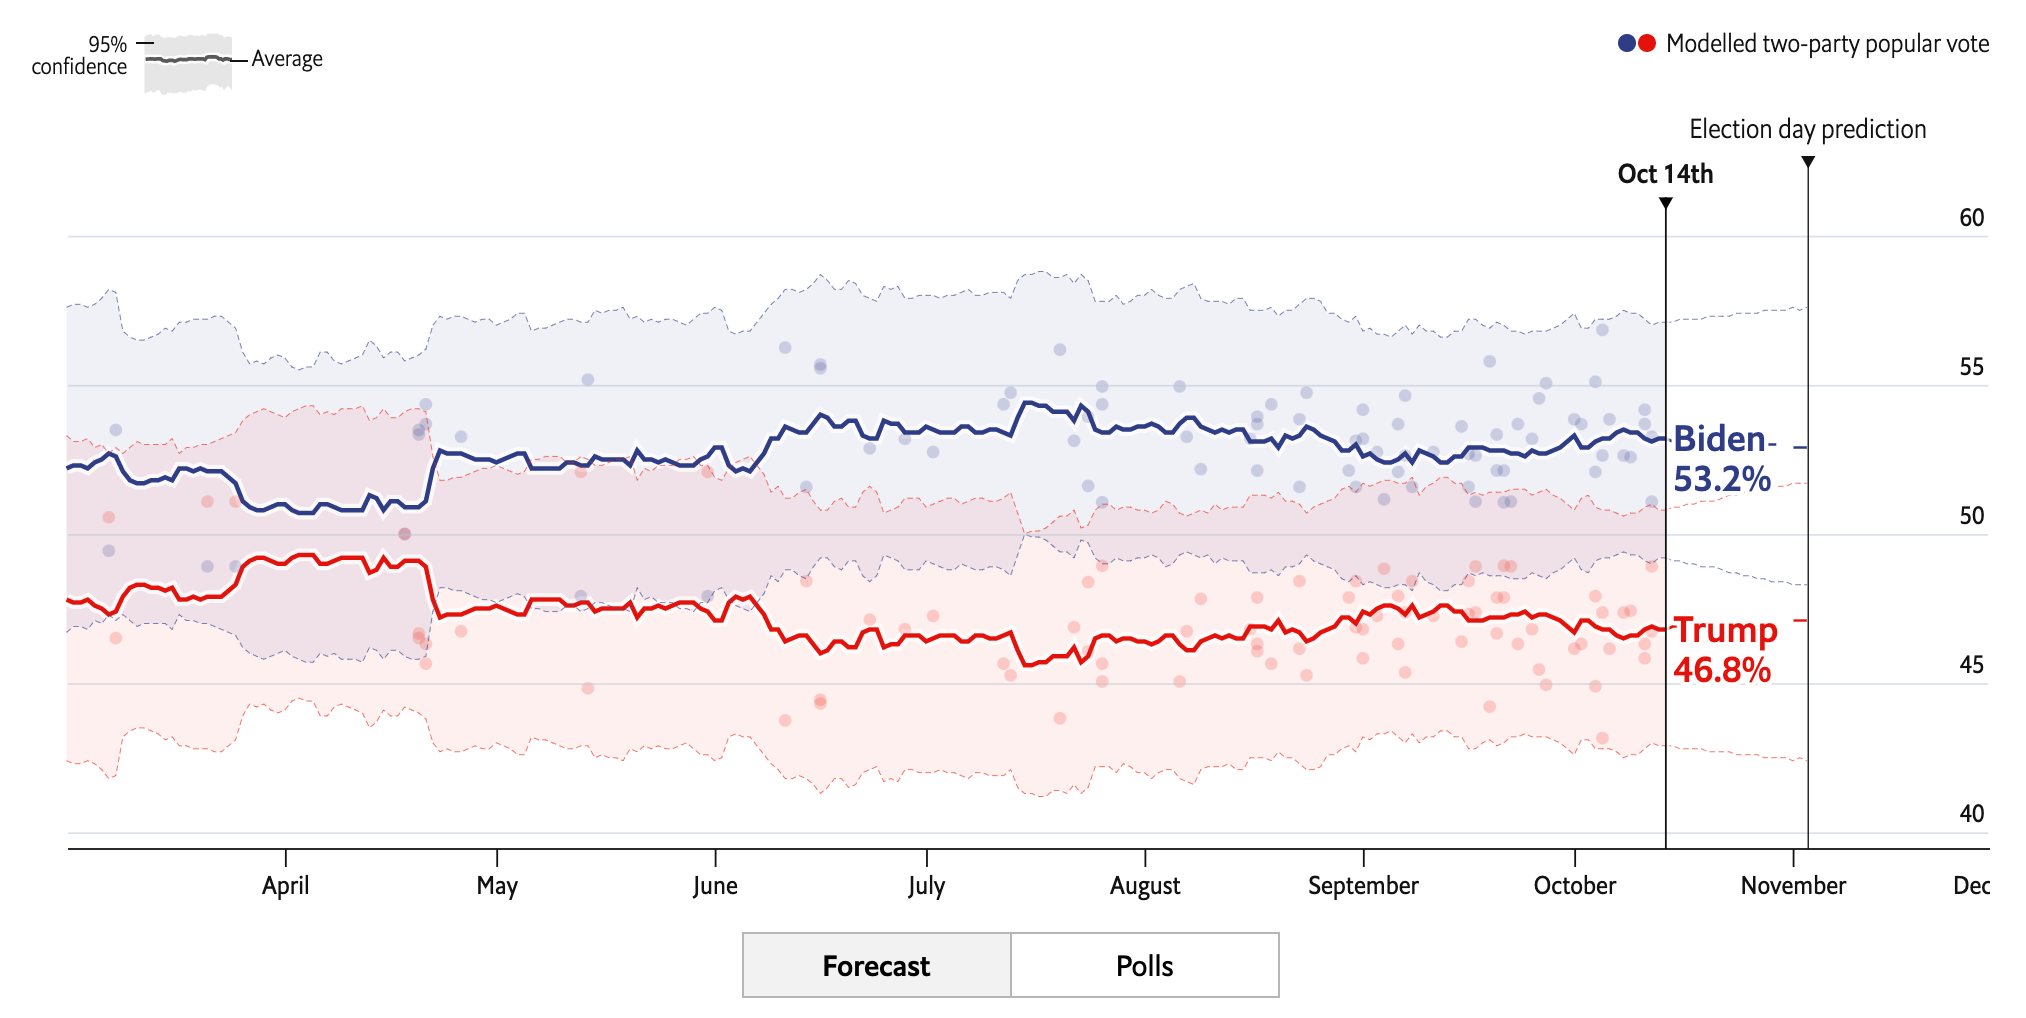
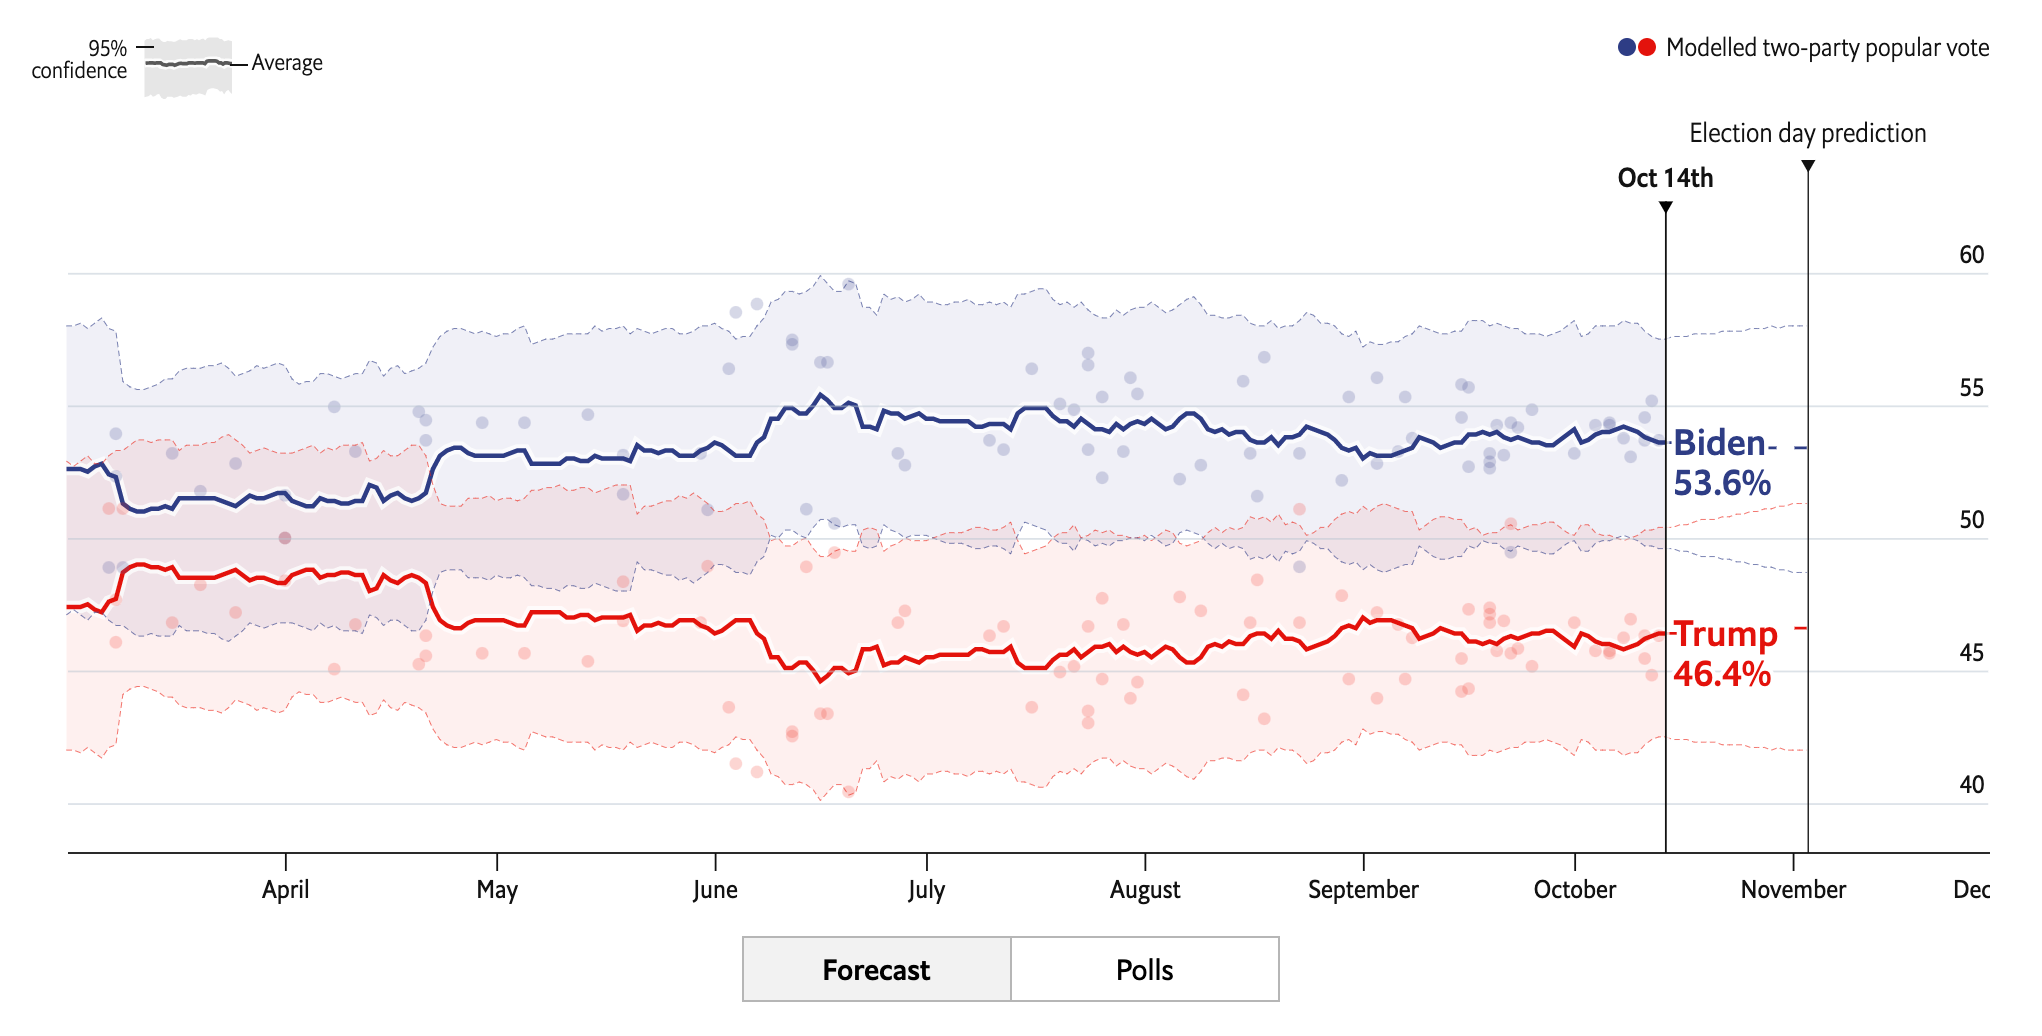
The best explanation is that state polls are much less favorable to Joe Biden than recent national polls have been—and that our models are based mostly on the state polls. Take The Economist’s averages in Pennsylvania and Michigan, for example. They haven’t budged at all since early October:
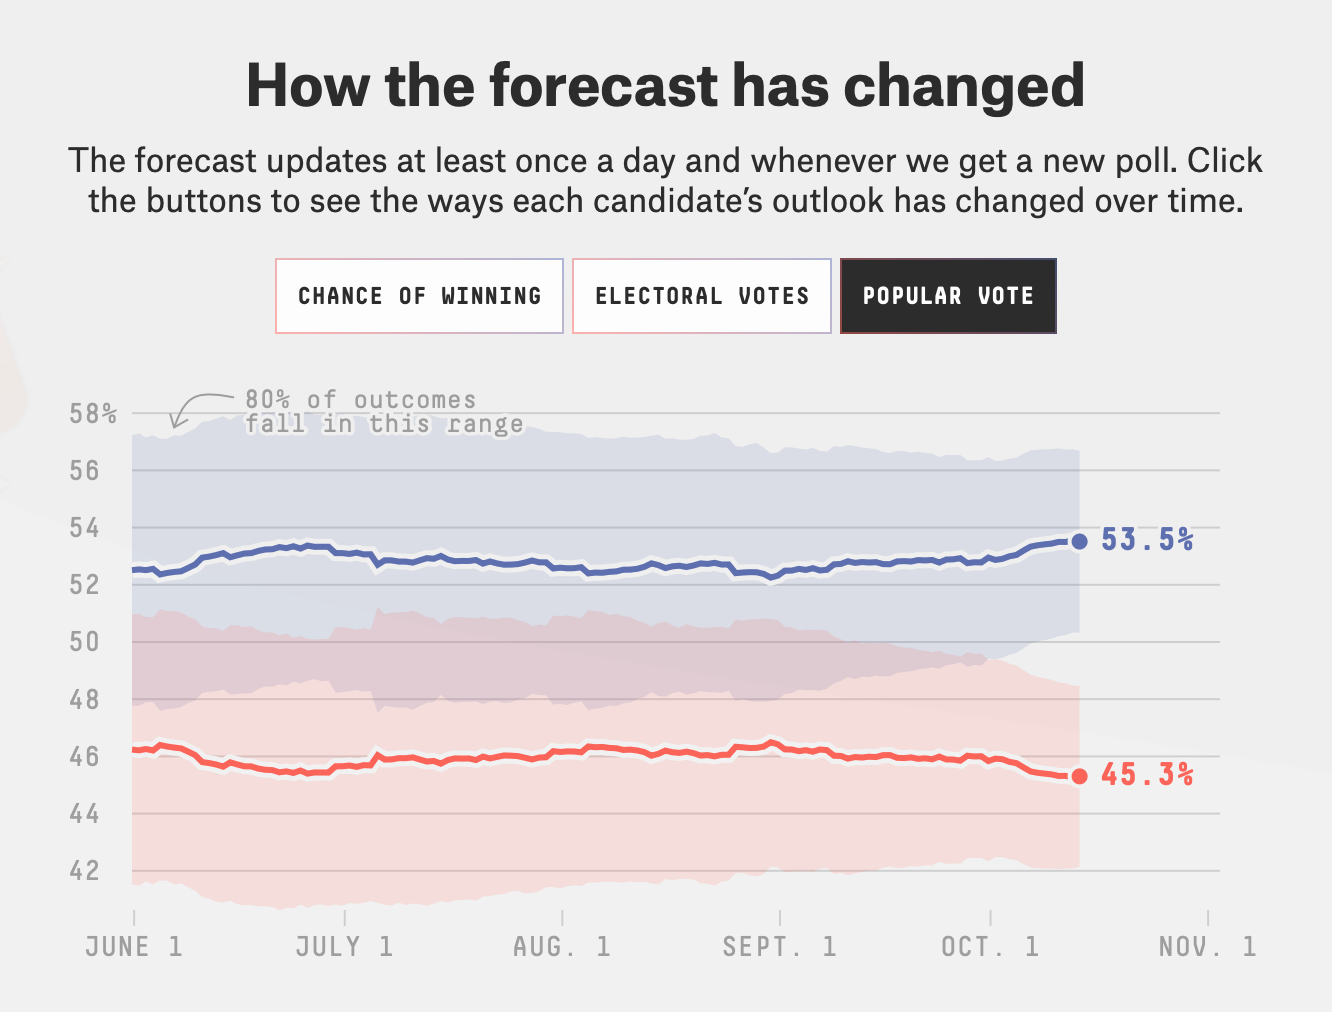
We can see the same dynamic in FiveThirtyEight’s election model. I’ve plotted their predicted election-day national popular vote below.
This prompts some reflection about how our election models work.
See, it is logical to think that our prediction for the national popular vote should be based on the average of national polls. After all, what else would we use?
But this causes a problem when you start aggregating state polls alongside the national ones. Primarily: what if the national vote implied by the state polls don’t match the national polls themselves? Which should you trust? Indeed, that’s the exact mismatch we’re seeing today!
The answer is that state polls are usually better at predicting the national popular vote, especially once you’ve removed their biases from mode, population and house effects.
As I’ve mentioned on this blog, the best way to predict state-level outcomes is to use state polls. The alternative is to apply some sort of national swing model based on the results in the last presidential election. If Texas was 10 points more Republican in 2016, for example, and the national margin in polls today is +10, then a national swing model would predict a tie in Texas. And that method of predicting state-level results has larger errors than national polls.
But our question is not about state results, but national results. That requires a different answer.
From square one, there is some conventional wisdom that the firms that conduct national polls are better than the firms that do state-level polls. The former are usually well-funded media pollsters, while the latter are often university outfits or legacy pollsters who stick to the old methods. (Actually, 2020 is notable in that lots of high-quality big firms are also doing state polls — but that’s a piece for another time.)
Some people also seem to think that change in state polls lags change in national polls, but I haven’t ever found much evidence for this.
The overall argument here is that state polls are worse, and so you shouldn’t rely on them. People point to the errors in the northern battlegrounds in 2016 as proof for this. After all, weren’t the national polls much better? That’s true in terms of absolute errors, at least for 2016, but with some sophisticated averaging state polls can often make better predictions of the national vote than the even the national polls can.
Again, take 2016. National polls were indeed pretty close to the result (538 had Clinton up 3.9 points in their average national polls; she won by 2), but the national vote implied by state polls was even better—they had Clinton up just 3.6 in their model. For an even starker difference: The Economist’s election model had Clinton up by +2.8 points in their modelling of state polls (a better performance because they adjusted for biases caused by poor weighting), whereas a raw average of national polls had her up 4. That’s a significant improvement in terms of probabilistic accuracy.
There are a few possible explanations for this dynamic, but the best is volume; In total, there are usually more state polls than national polls. Since we can leverage data on the number of voters in each state and their partisan leans to make inferences about what state polls mean for the national election, having an array of polls from a diverse set of modes and houses can provide a better signal about the national election than national pollsters can provide. That was true for sophisticated models in 2016, and also true for most models in 2012.
…
From this, I think that looking at the average of national polls might actually be a bit misleading. Aat least when state and national polls disagree, you might want to put more weight on what we learn from state polls.
But this raises one final question about 2020: if state polls are wrong, which way might the error point? So far, most people have been duped by an overwhelming sense of 2016 bias; assuming that polls underestimate Trump by default. That’s wrong for a ton of reasons, not least that polling error usually doesn’t point in the same direction cycle after cycle.
I think we can make a good argument that it’s the national polls that are right, in which case Joe Biden might very well have an upside that our models don’t currently see. This is a lazy way to end an article, but… I guess we’ll just have to wait and see.
Phew, nice. But how many states actually have decent polls?