Are preferences for more government spending a residual Trump effect, or the new normal? 📊 May 2, 2021
The answer to the question will shape the next three to seven years of Joe Biden's presidency
Thanks as ever for reading my weekly data-driven newsletter on politics, polling, and democracy. I invite you to drop me a line or leave a comment below with your thoughts. Remember to click the ❤️ under the headline if you like what you’re reading. If you want more content, I send out extra subscribers-only posts twice a week. Sign up here.
Are preferences for more government spending a residual Trump effect, or the new normal?
Joe Biden’s 100-day address to a joint session of Congress this week laid out a once-in-a-generation progressive agenda for the size and scope of the government. His economic stimulus, infrastructure spending, and families plan represent both a massive increase in public investment and a break with previous administrations in the view of how expansionist the government should be when it comes to improving the quality of life for individual citizens.
This is what the public wants. Polls show the administration’s top proposals are popular with supermajorities of Americans — up to 70%, in some cases. When it comes to government spending money, the people, at least right now, are all for it.
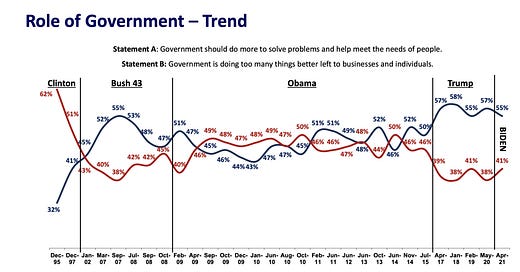
How does this compare to the last twenty years of American political history? Using polling data from NBC News, we can look at how public preferences for the role of government have changed over time. NBC’s polling reveals the share of Americans who think “government should do more to solve problems and help meet the needs of people” (55%) is fourteen percentage points higher than the share who say the government “is doing too many things better left to businesses and individuals” (41%).
The people have a more expansionist view of the role of government than they’ve had at any point during the last fourteen years. The current high in popularity for a larger scope for the government has also persistent far longer than the previous one; since Donald Trump to office in 2017. In comparison, the recession-era high lasted only a year and a half.
But the trend has started moving in the opposite direction. In January 2018, even more Americans wanted a broader role for government than they do today. Of course, that decrease could be due to random sampling error, but it could also be a significant shift in spending preferences now that a Democrat is in office. Political scientists have observed that preferences for public spending react to levels of spending in a so-called “thermostatic” model; when the printing press heats up, people adjust the thermostat to cool it down, and vice versa. Maybe the high levels of spending we’re observing right now are simply an artifact of Donald Trump’s presidency when policies hadn’t adjusted to the public’s desired levels of spending.
A shift in the trend in spending preferences towards less government and more individualism could imperil Joe Biden’s approval ratings, which have so far been buttressed by his popular plans and handling of the coronavirus pandemic.
But if the public has permanently taken up a more liberal view on the size and scope of our government, Biden could continue to push for more spending over the remainder of his tenure in office.
Posts for subscribers
April 29: Why we can't easily compare Joe Biden's approval ratings with past presidents' numbers. Polarization has introduced hard upper and lower bounds to a president's performance, making longer historical comparisons irrelevant without proper context
Plus: the weekly subscribers chat on a few key polls released over the last week.
Links to what I’m reading
We launched a new project on public opinion towards Biden and key policies at work this week. I’d love it if you checked it out.
Laura Bronner and Nathaniel Rakich at FiveThirtyEight have put together a great series of charts on the pro-Republican bias of the country’s electoral institutions. It is great to see 538 cover these biases as threats to our representative government, as data journalism over the past few years has too often ignored the normative challenges these biases presented.
David Shor has a few charts with early 2022 midterm predictions, showing an R+4 mean prediction (but with a very wide confidence interval). For what it’s worth, that is close to the implied R+3 environment that this weekend’s special election in Texas’s 6th congressional district forecasts.
Here is a new paper from Chris Warshaw and co-authors on the effects of Fox News on Republican vote share, partisanship, and ideology between 2000 and 2020. It confirms what you’d expect — namely, that places that watch more Fox vote more Republican than you’d expect based on other demographic and political variables — but novel methods of quantification are good even if the finding isn’t shocking!
Feedback / Share and subscribe!
That’s it for this week. Thanks so much for reading. If you have any feedback, please send it to me at this address — or respond directly to this email.
If you want more content, you can sign up for subscribers-only posts below. I’ll send you one or two extra articles each week, and you get access to a weekly gated thread for subscribers. As a reminder, I have cheaper subscriptions for students.
In the meantime, follow me on Twitter for related musings.


Hey Elliott - took me a bit to notice, but it looks like the folks @NBC spaced the poll results evenly along the x axis. Makes the Obama years look a lot more stable just because of the number of polls. Here's a chart w/the axis corrected (w/a loess instead of connecting the points):
https://raw.githubusercontent.com/markjrieke/thedatadiary/main/2021.05.03-misc_ish/p1.png