


Are elections getting easier to predict? 📊 August 16, 2020
Polarization makes landslides less likely—but small changes are even more important in close contests

If you don’t believe the polls, maybe you would prefer a quantitative analysis of whether ”flotilla boat parades” are predictive of election outcomes. They probably rank somewhere between shark attacks and Halloween costumes. And this is my weekly newsletter.
As always, I invite you to drop me a line (or just respond to this email). Please hit the ❤️ below the title if you like what you’re reading; it’s our little trick to sway Substack’s curation algorithm. If you want more content, I publish subscriber-only posts 1-2x a week.
Dear reader,
There are a lot of things to focus on right now that are more important than the horse race. The lobotomy at the postal service should be concerning to anyone who thinks the integrity of our voting system is important to a well-functioning democracy. An eviction crisis among hard-hit Americans threatens homelessness for millions—and that’s before pandemic assistance ends or gets cut for many unemployed workers.
And then, you know, there’s still a deadly virus circulating outside (and, as of last week, inside my apartment building).
But, frankly, I don’t have much insight on those topics. I hope that congress can fund efforts to shore up postal voting in November. Lower UI payments might hurt the economy. A vaccine still seems a long way off, very likely so far as to not impact most people before the election. It’s probably best that I use my archive of polling data to talk about the horse race, where I can provide added value.
So this week I want to run through a series of charts that justify why I think elections are easier to predict now than they used to be (and why the uncertainty in Nate Silver’s election forecast could be too high).
Stay safe and be well,
Elliott
Are elections getting easier to predict?
Polarization makes landslides less likely—but small changes are even more important in close contests
One of the things I think political analysts have overlooked is how political polarization has changed the contours of election campaigns. Too often the media focus on the subject has been about how partisanship drives us apart and makes compromise harder, but in election years the story is different—and perhaps more important.
One of the broader findings from political science literature is that polarization creates higher floors and lower ceilings for political candidates. Nowadays it is nearly impossible to recreate some of the landslide victories of the 20th century.
This also means that outcomes are more predictable. That doesn’t mean winners are easier to pick in a binary fashion, to be sure, but that the plausible range of outcomes is narrower and easier to guess earlier in the election years.
We can see this in the polling data. The plot shows how polls change from January to November of each year, with higher lines representing incumbent-party candidates who gained ground and lower lines mean a candidate lost ground. The blue line is 2020.
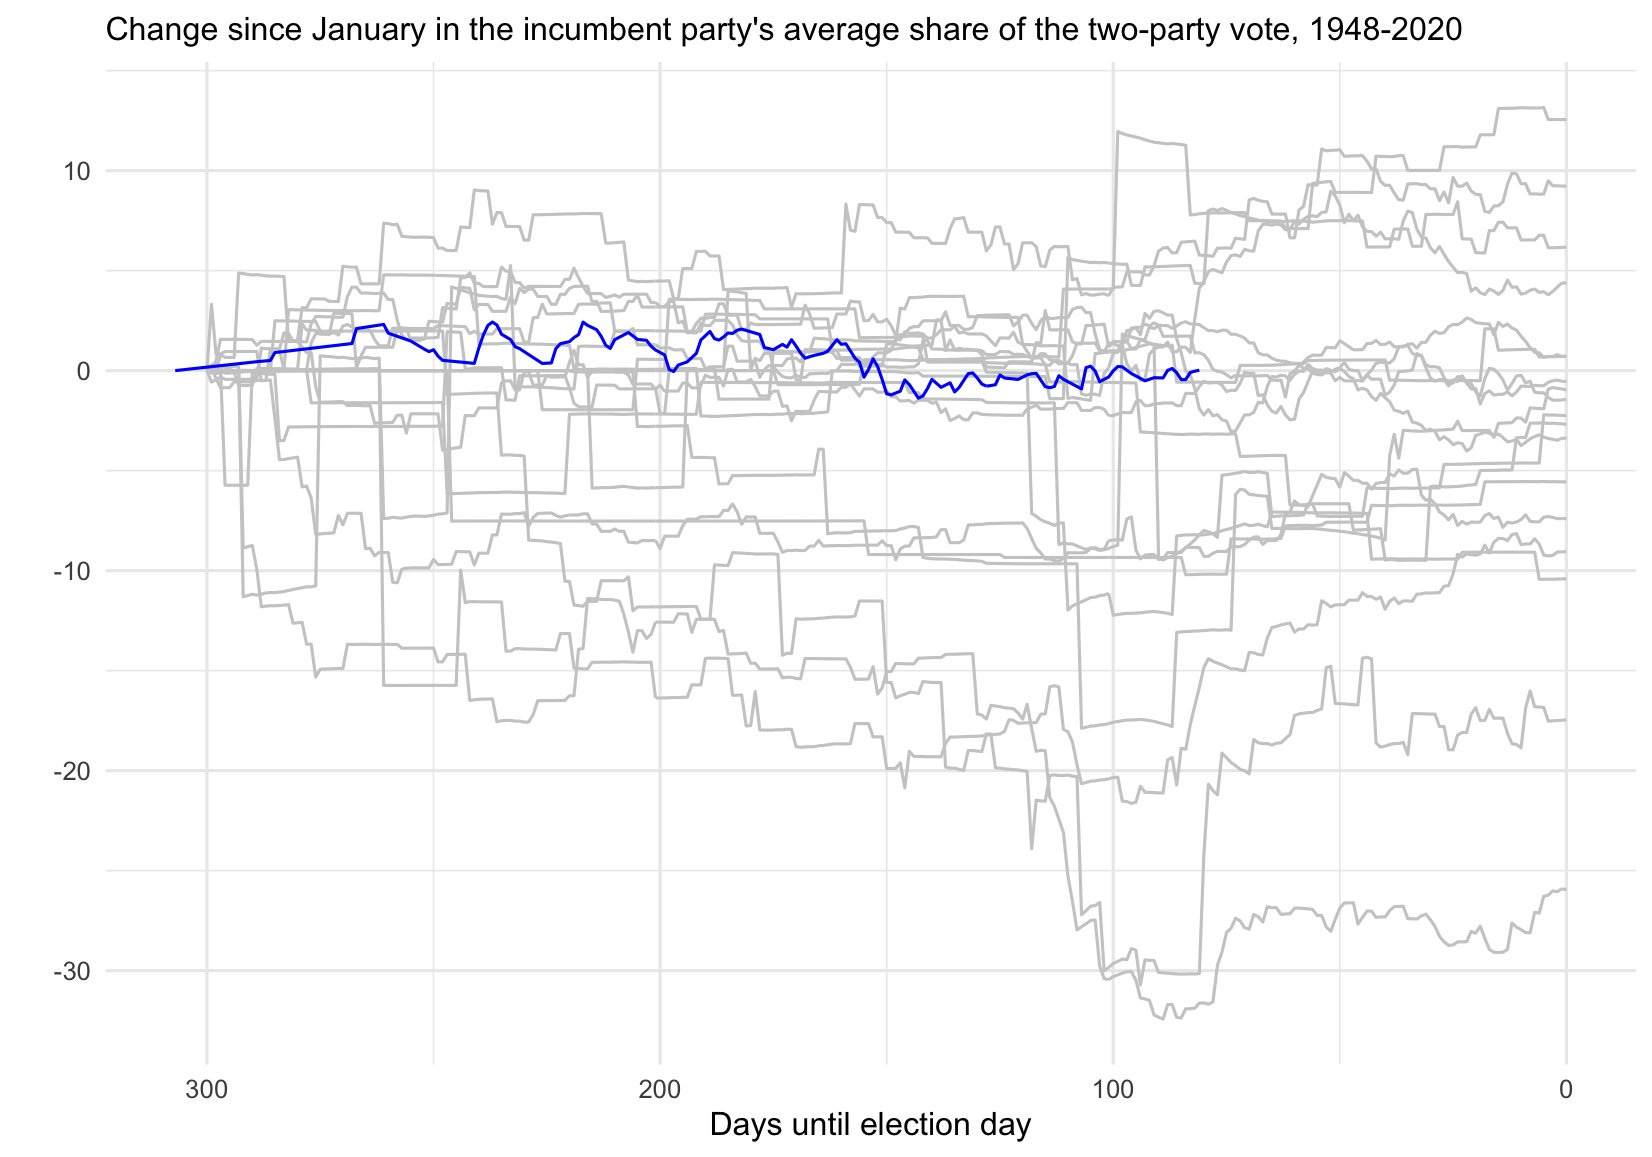
This year’s polls have been pretty remarkably stable. But 2020 isn’t the only campaign that looks like this. Recent years fit the trend too. Here’s a chart showing the absolute change in pre-election polls from this point in the cycle to election day. The blue lines represent years since 2000.
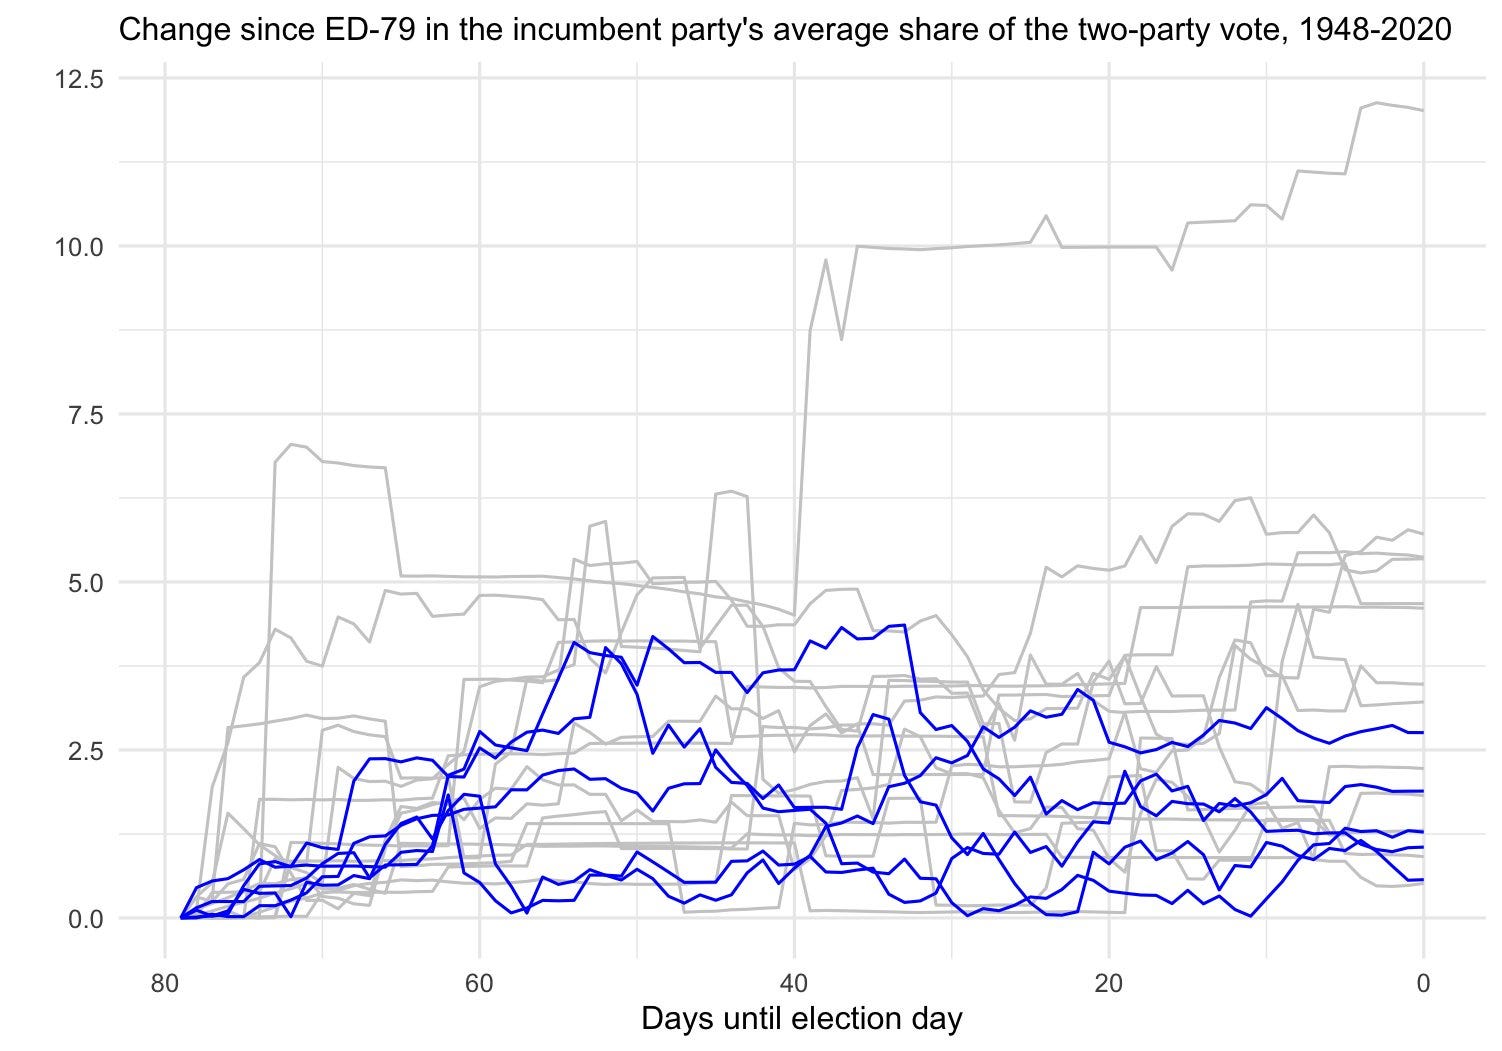
In elections from 1948 to 2016, you would expect polls to move with a standard deviation of about 4 points on the incumbent party’s vote share between now and November 3rd. But if you subset to the previous 5 elections, that number drops by even more than half, with the standard deviation on change in the polls landing around 2 points. This means that a candidate up 8 points today would win the national popular vote about 95% of the time.
Shown another way, you can see that these shifts align pretty close to a linear trend with political polarization—specifically, the share of the electorate that voted for a different party’s candidate in each of the most recent two presidential elections. The relationship is not perfect (see 1976) but it is still statistically significant and explains an important development in how elections work.

So, what does this all add up to?
Well, in modern elections, it has become uncommon to see large shifts late in the race. By the fall the vast majority of voters have made their decisions. This means that handicappers assuming the distribution of changes in the horse-race will be as large now as it was in eg 1988 will be underfitting potential results. They will assign too high of probabilities to unlikely drifts in the national environment—like a 10% chance that Biden will win the election by 16 points or more.
There is a flip side to this, however. Because elections are closer on average than they used to be, smaller changes in the race can still have large impacts on candidates’ odds of winning or losing. An election that is close to 50-50 or even 52-48 (unlike this year’s contest) can still be flipped rather easily. So while a candidate with a big lead is in a safer position now than they would have been in the 1970s or 1980s, elections will be closer and more competitive on average.
Importantly, 2020 fits the first part of that penultimate sentence.
Posts for subscribers
August 14: Reasonable bounds on presidential election outcomes. How can we know how wide the tails should be?
Plus, this post on job advice for new/upcoming data journalists is ungated for everyone.
What I'm Reading and Working On
I wrote three articles for The Economist last week. One was about figuring out the consequences of an undercount of Hispanic Americans in this year’s census. The second used data from our election forecast to analyze how the electoral college magnifies the voting power of white Americans. And the third was for our “Checks and Balance” newsletter on whether anger or enthusiasm is a stronger motivator of political action.
This week I’ll be simulating the impacts that increased vote-by-mail and turmoil at the postal service might have on the results of the election. The short story is that we should all be concerned about this, regardless of our party affiliation. (The slightly-less-short story is that although effects are likely to be small on average, they could be quite large, and Democrats should be particularly concerned because it is their votes that will be disproportionately discarded if trouble materializes.)
Finally, this weekend I started reading The Sum of the People, a history of censuses (not just America’s) by data scientist/economist Andrew Whitby. It’s really good and I recommend that you read it.
Thanks for reading!
Thanks for reading. I’ll be back in your inbox next Sunday. In the meantime, follow me online or reach out via email if you’d like to engage. I’d love to hear from you.
If you want more content, I publish subscriber-only posts on Substack 1-3 times each week. Sign up today for $5/month (or $50/year) by clicking on the following button. Even if you don't want the extra posts, the funds go toward supporting the time spent writing this free, weekly letter. Your support makes this all possible!
Photo contest
I received many pictures of dogs and cats (and even some birds!) after last week’s edition. Thank you! Here is Hobbes, who I picked both because I was obsessed with Calvin and Hobbes when I was younger and because I’ve been thinking about social contracts recently. For next week, send in a photo of your pet(s) to elliott@gelliottmorris.com.

Census book sounds good!