


An early probabilistic forecast for the 2020 presidential election 📊 February 23, 2020
My models predict a close race fought across 11 swing states

Welcome! I’m G. Elliott Morris, a data journalist at The Economist and blogger of polls, elections, and political science. Happy Sunday! This is my weekly email where I write about politics using data and share links to what I’ve been reading and writing.
Thoughts? Drop me a line (or just respond to this email). Like what you’re reading? Tap the ❤️ below the title and share with your friends! If you want more content, I publish subscriber-only posts 1-3x a week.
An early probabilistic forecast for the 2020 presidential election
My models predict a close race fought across 11 swing states
I’m sure many of you astute news-watchers have noticed Donald Trump’s improving approval ratings over the last couple weeks. Indeed, FiveThirtyEight gave Trump his highest ratings ever—a net approval of -5—last week. And though I think this increase is exaggerated for a few reasons, Trump’s footing has probably increased slightly over the past few months. (It’s worth noting that his net rating has since fallen back down to earth a bit.)
I took to Twitter last week to wonder aloud about what might happen in the election if Trump’s net approval rating had indeed improved to -5 (45% approval and 50% disapproval. I put together a suite of statistical models to get a rough idea, but I ended up coming up with a relatively fully-fledged early forecast of the 2020 election.
The typical approach to coming up with a pre-election forecast is to train a predictive model on the relationship between the state of the economy, the president’s approval rating and his eventual vote share. Using data from Alan Abramowitz—the political scientist behind the Time for Change model—I can predict a range of outcomes for Trump’s vote share under different approval ratings and GDP growth.
But instead of just rehashing the old methods (most political scientists train a simple linear regression model between these variables) I added a little twist. In addition to presidential approval ratings and GDP growth, I used a variable to account for the chance that the influence these variables have on voters’ choices has changed over time. We have reason to believe that the state of the economy, in particular, plays less a role now than in the mid-1900s. Then I fed the data into a cross-validated model that uses elastic net regularization to avoid over-fitting and provide for some basic implementation of model selection.
I shared the results in this tweet:


Yet there are a few weaknesses to this approach. Primarily, the high likelihood of a mismatch the national popular vote and the electoral college outcome poses an obvious barrier to learning much from predictions of the former. Some analysts try to remedy this issue by translating the predicted national popular vote to state-level predictions by adding the implied election-to-election swing in the national vote to the last state-level results. This method has a pretty good track record historically, including performing admirably in 2016.
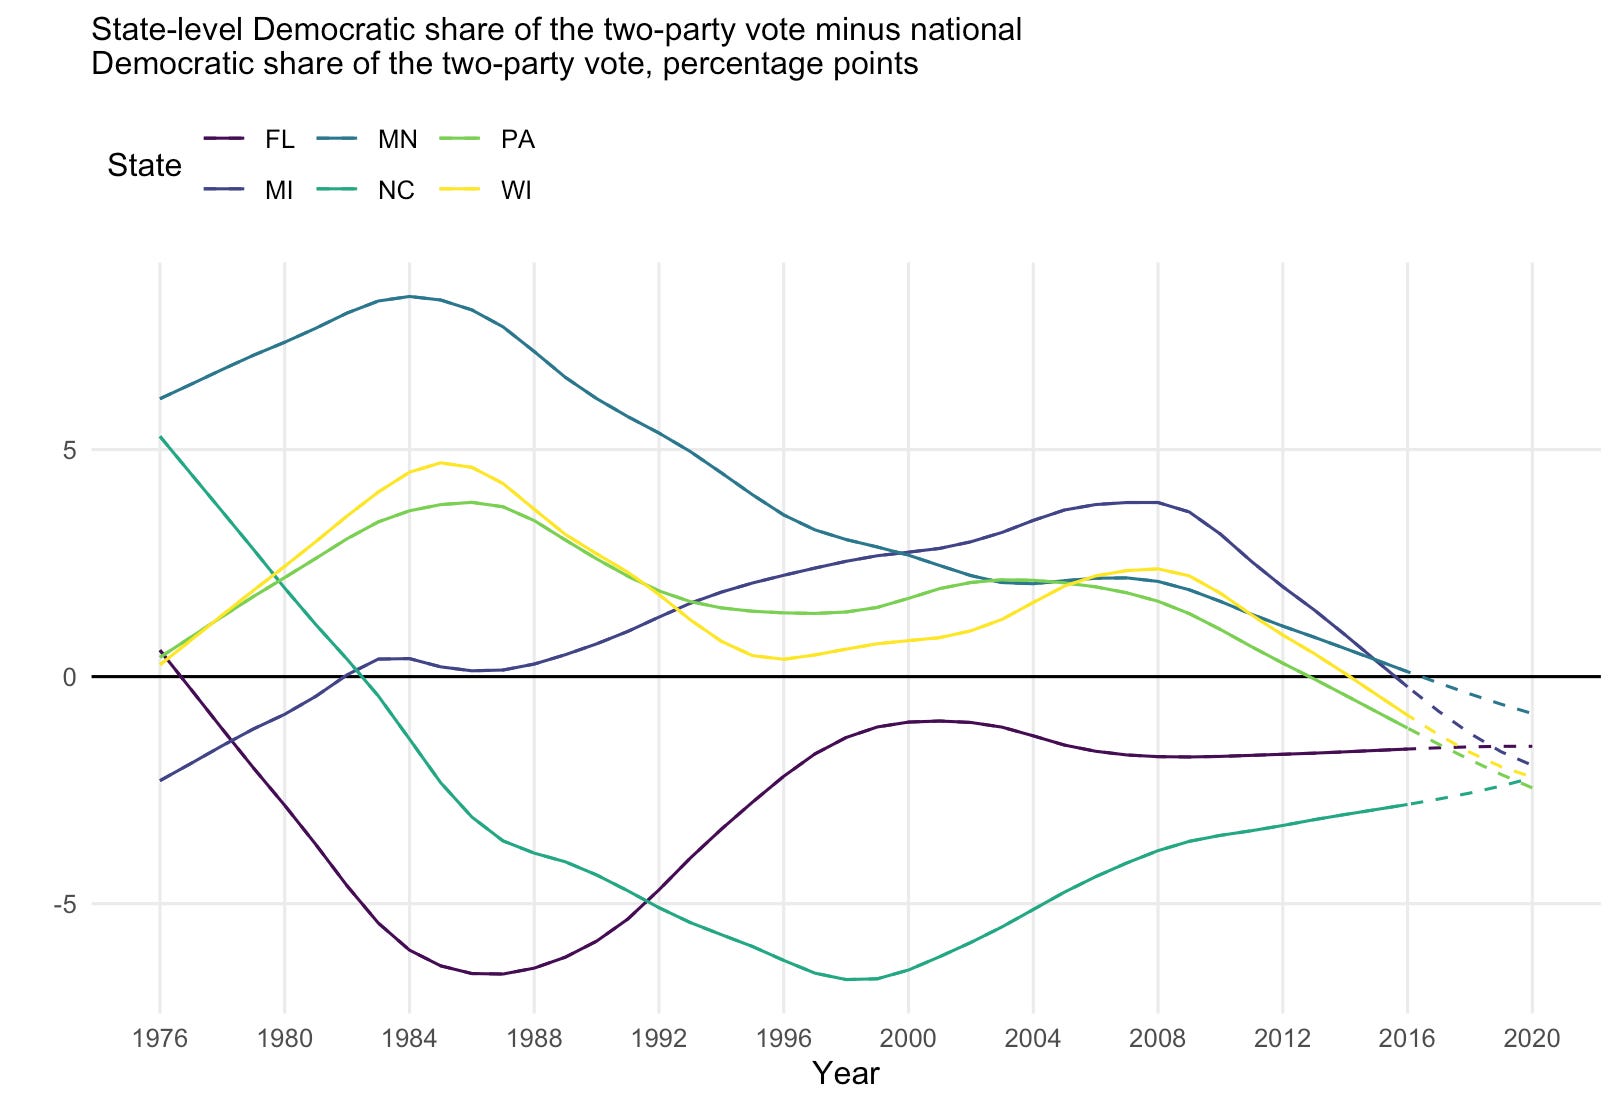
Here, I added another twist on the historical methods. It seems to me that a state-level “fundamentals” forecast—the name we give to models that predict the election with economic indicators and political measurements with a lot of lead time—ought to take into account election-to-election swing in state-level politics as well as the swing in the national vote share. There could be some underlying demographic factors driving, e.g., Arizona to the left and Florida to the right that we’re missing by just adding a national delta to the previous state-level election results. So I trained another set of models to predict short-term trends in state-level partisan lean. This way, we have a prediction for how much the Democratic share of the two-party vote in each state will vary from the national popular vote that takes trends in state-level politics into account. The predictions for 2020 look like so:
Then, all we have to do to get predictions for November is add together the predictions for the national popular vote and state-level lean in Democratic vote share. The results look like this:
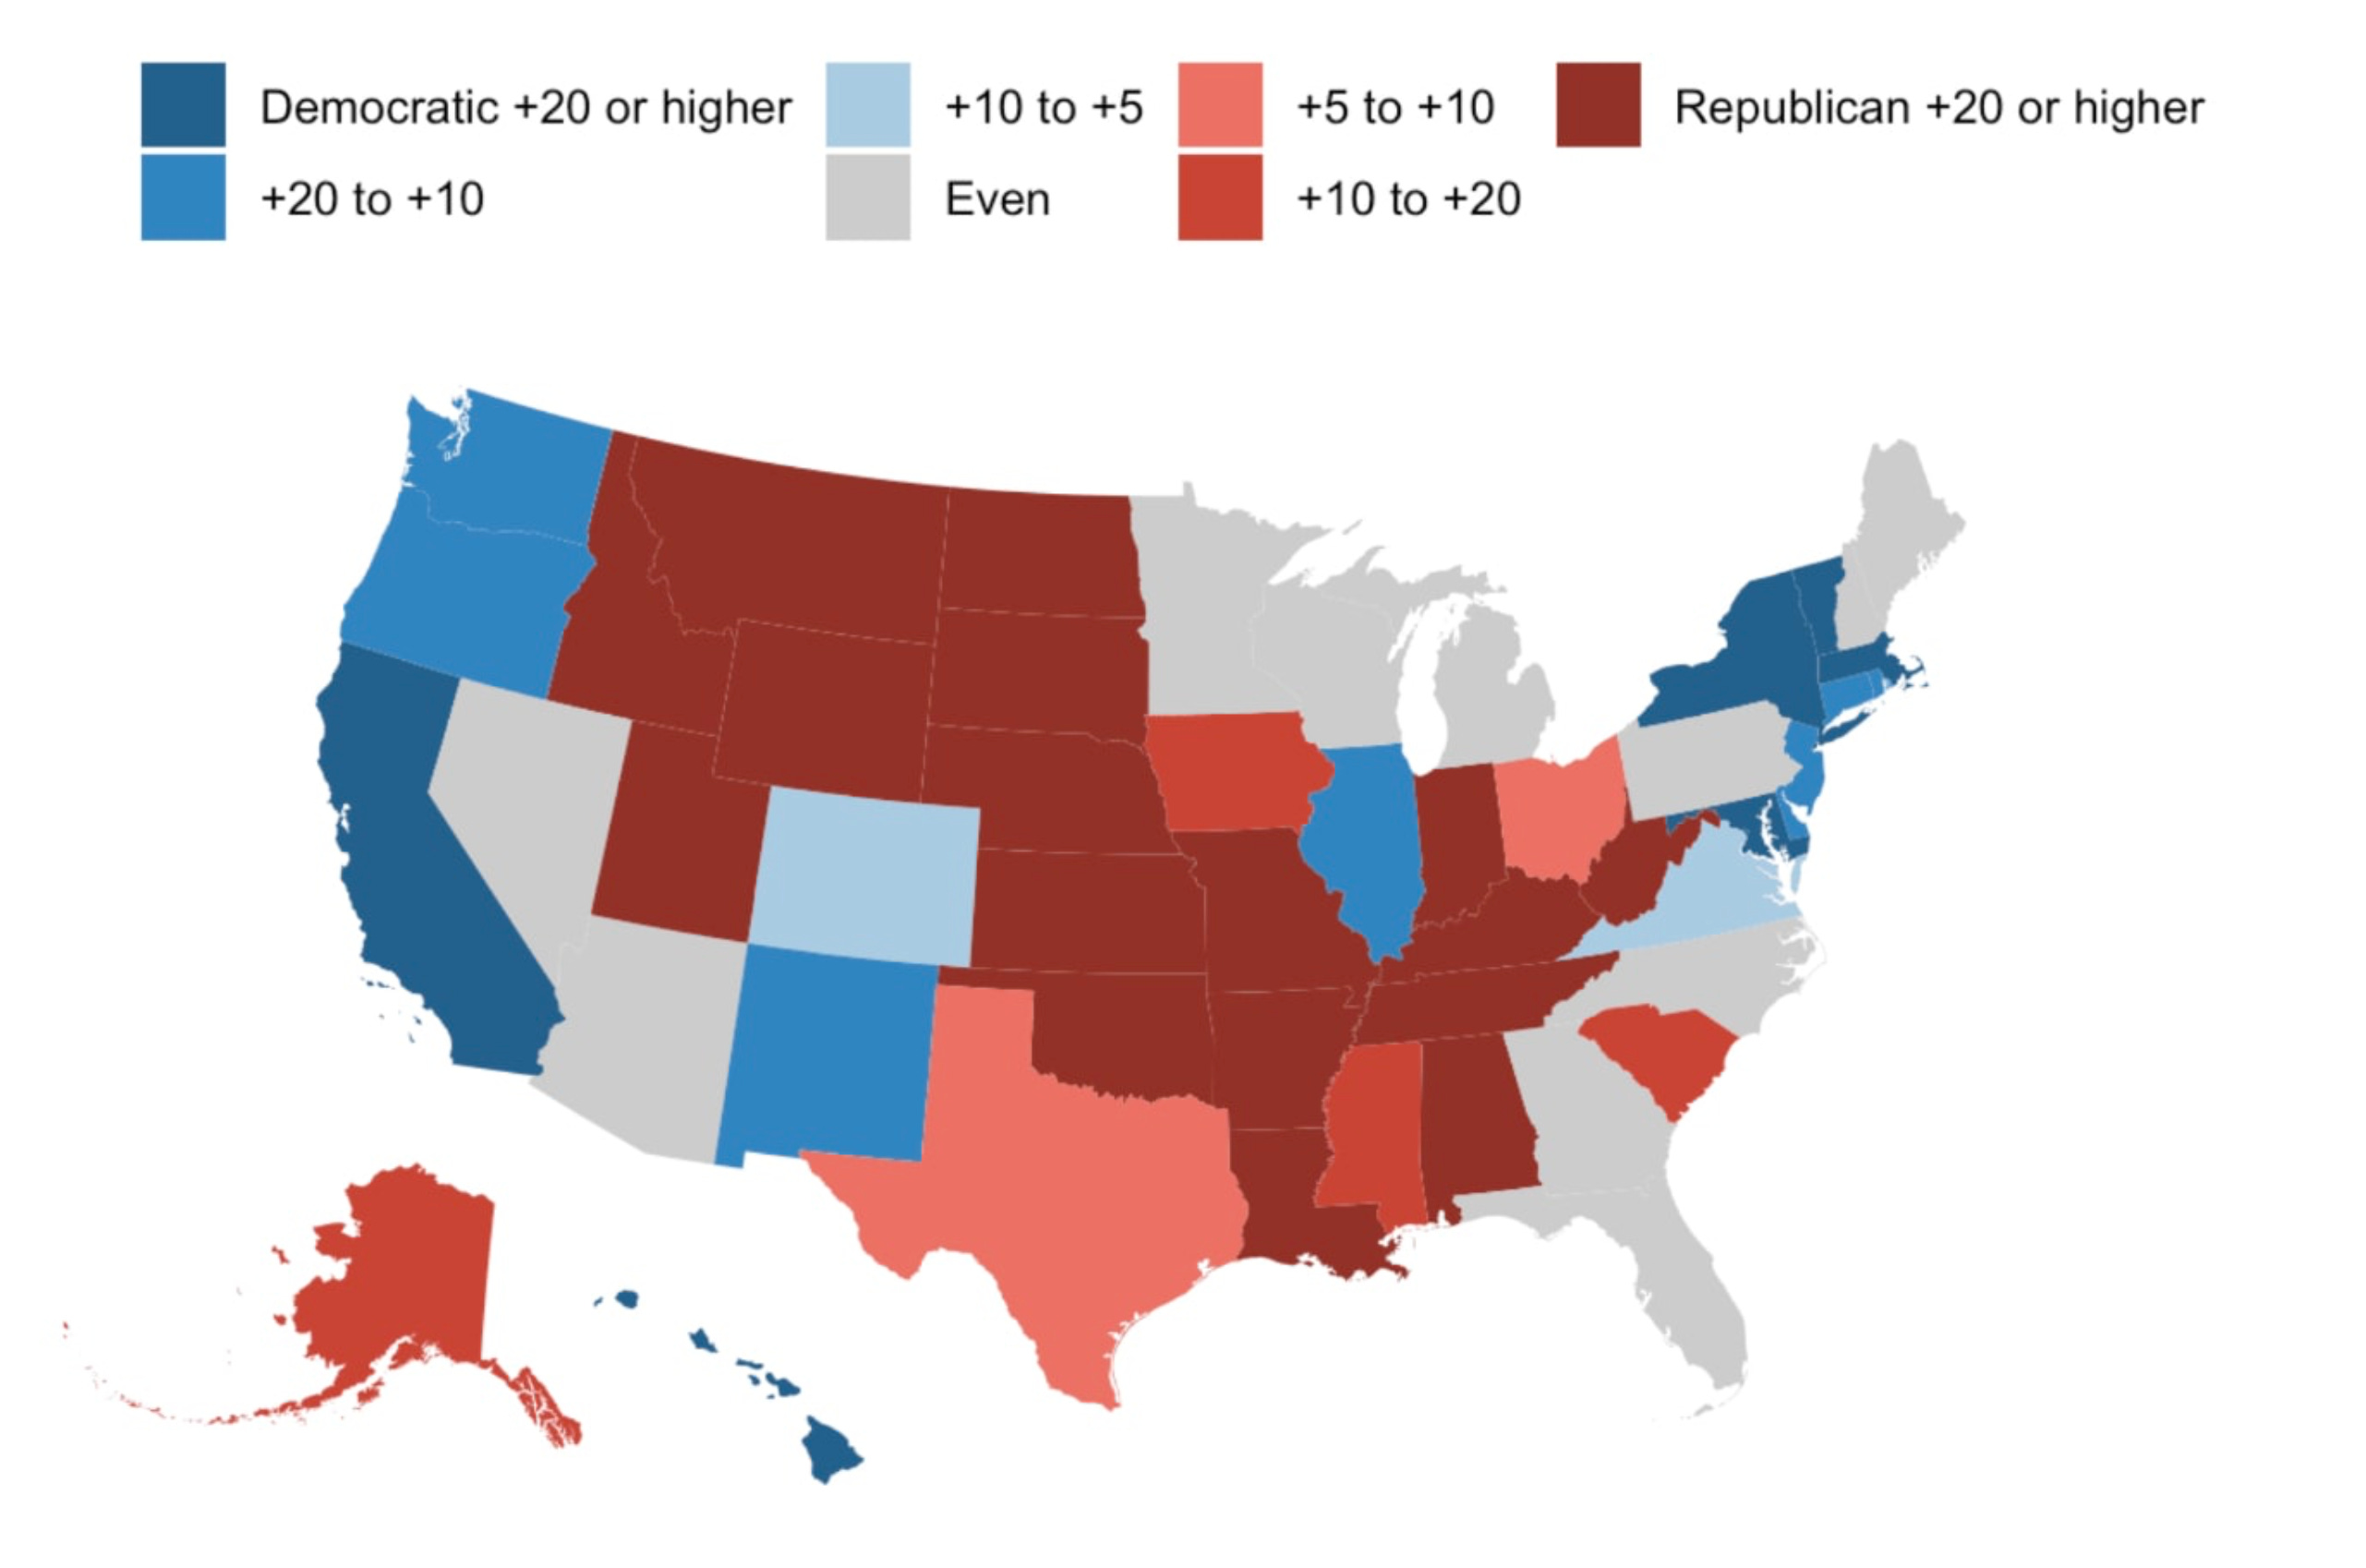
In such a scenario, neither the Democratic candidate nor Donald Trump would have enough electoral votes from states in which they’re favored to win the election:
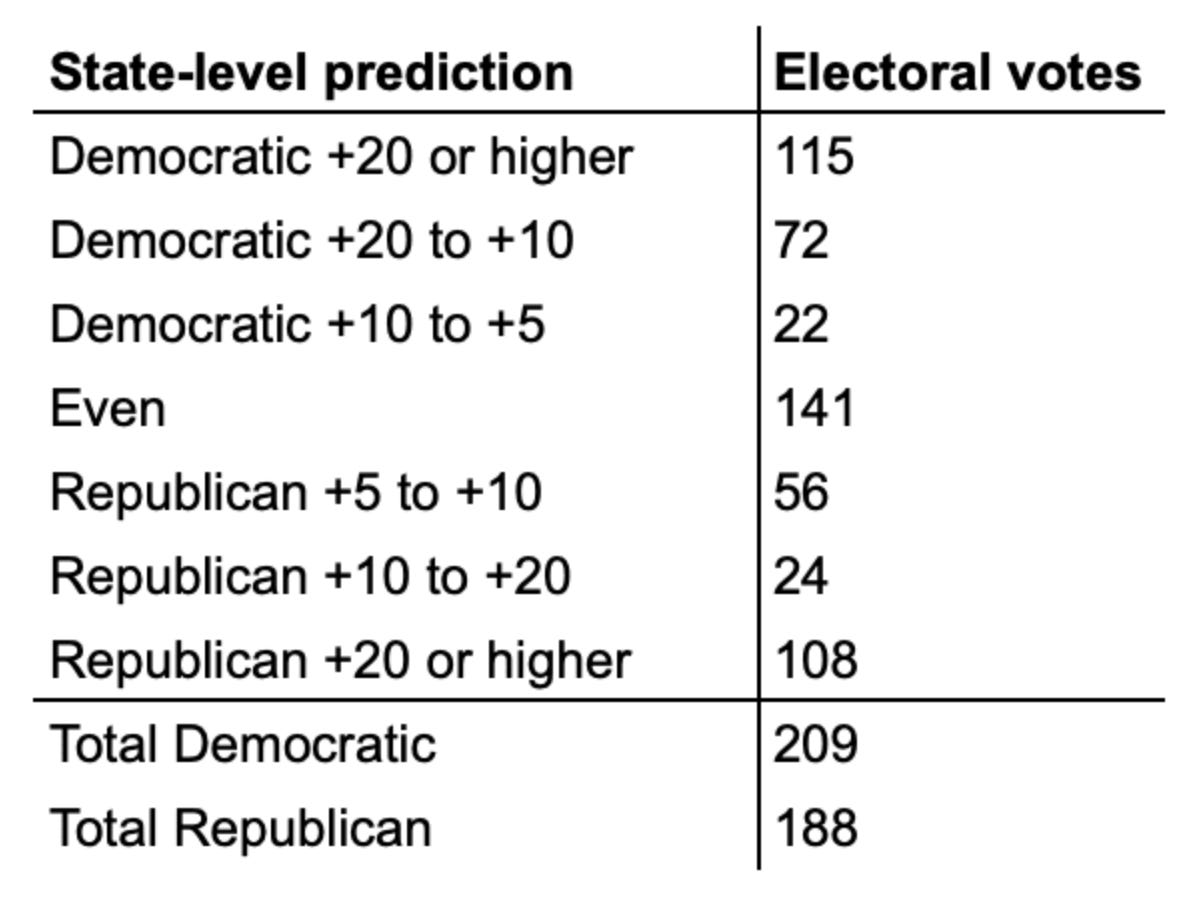
The election would be close, in other words. But how close? How likely is a Democratic or Republican electoral college majority?
We can quantify the uncertainty in our forecasts by plugging in the predictions to a computer program that simulates the election a million times, in each “trial” varying the Democrats’ predicted state-level vote by between roughly -14 and +14 percentage points to account for the error in the national and state-level models. We get a distribution of possible electoral votes that looks like this, with the more likely outcomes having higher bars.

Tally up the predicted votes and you get a 57% chance of Democratic electoral college victory.
Some caveats
As always, there are caveats in these models. I mentioned already that the national popular vote model is weakened by its inability to predict state-level outcomes. It’s also weakened by the chance that the election cycle does not unfold as history predicts. The model thinks that the president will both become more popular as the election season wears on and that he will outperform his approval rating in the battle box. While these are probably good binary predictions to make (both are likely to happen) it’s hard to know how much Donald Trump will stray from the projected path.
There’s also the caveat that the model is trained on the historical relationship between the president’s approval ratings in June, but we’ve inputted Trump’s approval rating in late February. So there is even more error in the model in projecting the president’s June approval rating with his rating in February.
And it could be that our prediction for state-level lean is off. We try to take this into account in the simulation, but sometimes, just using last year’s partisan lean is better than trying to predict it forward.
The good news is that we can explore these scenarios. If we predict that Democrats will win 52.5% of the two-party vote come November—roughly what they’re polling at today—the model spits out these predictions, for example:

Similarly, if we simulate the range of possible elections where Trump is polling at -5 approval today—a projected national vote share of 50%—the expected probability of a Democratic electoral college majority falls to roughly 35%.
The point is that our predictions rely heavily upon both the starting data and the assumptions we feed into our models. Those assumptions can change over time, and we should revisit this subject in the summer when we have data that better fit the model.
Notes on interpretation
I’ve titled this newsletter “An early probabilistic forecast for the 2020 presidential election” but I’d rather not have everyone sharing these forecasts as if they are gospel. Instead, as I noted on Twitter, I believe we think about these predictions as Bayesians, using them as an informative prior on the electoral environment that we update as we (a) get close to the election and (b) get more polling data. In fact, that’s how our final 2020 forecasting model will behave, combining these prior predictions with data from polls to come up with a posterior prediction—one that combines the information from all these sources.
Posts for subscribers
February 20: If 45% of adults approve of Trump, how many will vote for him?
Polls don’t provide a clear answer.
Links and Other Stuff
After Nevada, is it Bernie’s nomination to lose?
I enjoyed Nate Silver’s post-Nevada take. Nate Cohn’s from last week is also worth reading.
What I'm Reading and Working On
I’ll have a piece out on swing voters in the 2020 election this week. Make sure you’re signed up to The Economist’s US politics newsletter to get it.
Thanks for reading!
Thanks for reading. I’ll be back in your inbox next Sunday. In the meantime, follow me online or reach out via email if you’d like to engage. I’d love to hear from you!
If you want more content, I publish subscribers-only posts on Substack 1-3 times each week. Sign up today for $5/month (or $50/year) by clicking on the following button. Even if you don't want the extra posts, the funds go toward supporting the time spent writing this free, weekly letter. Your support makes this all possible!